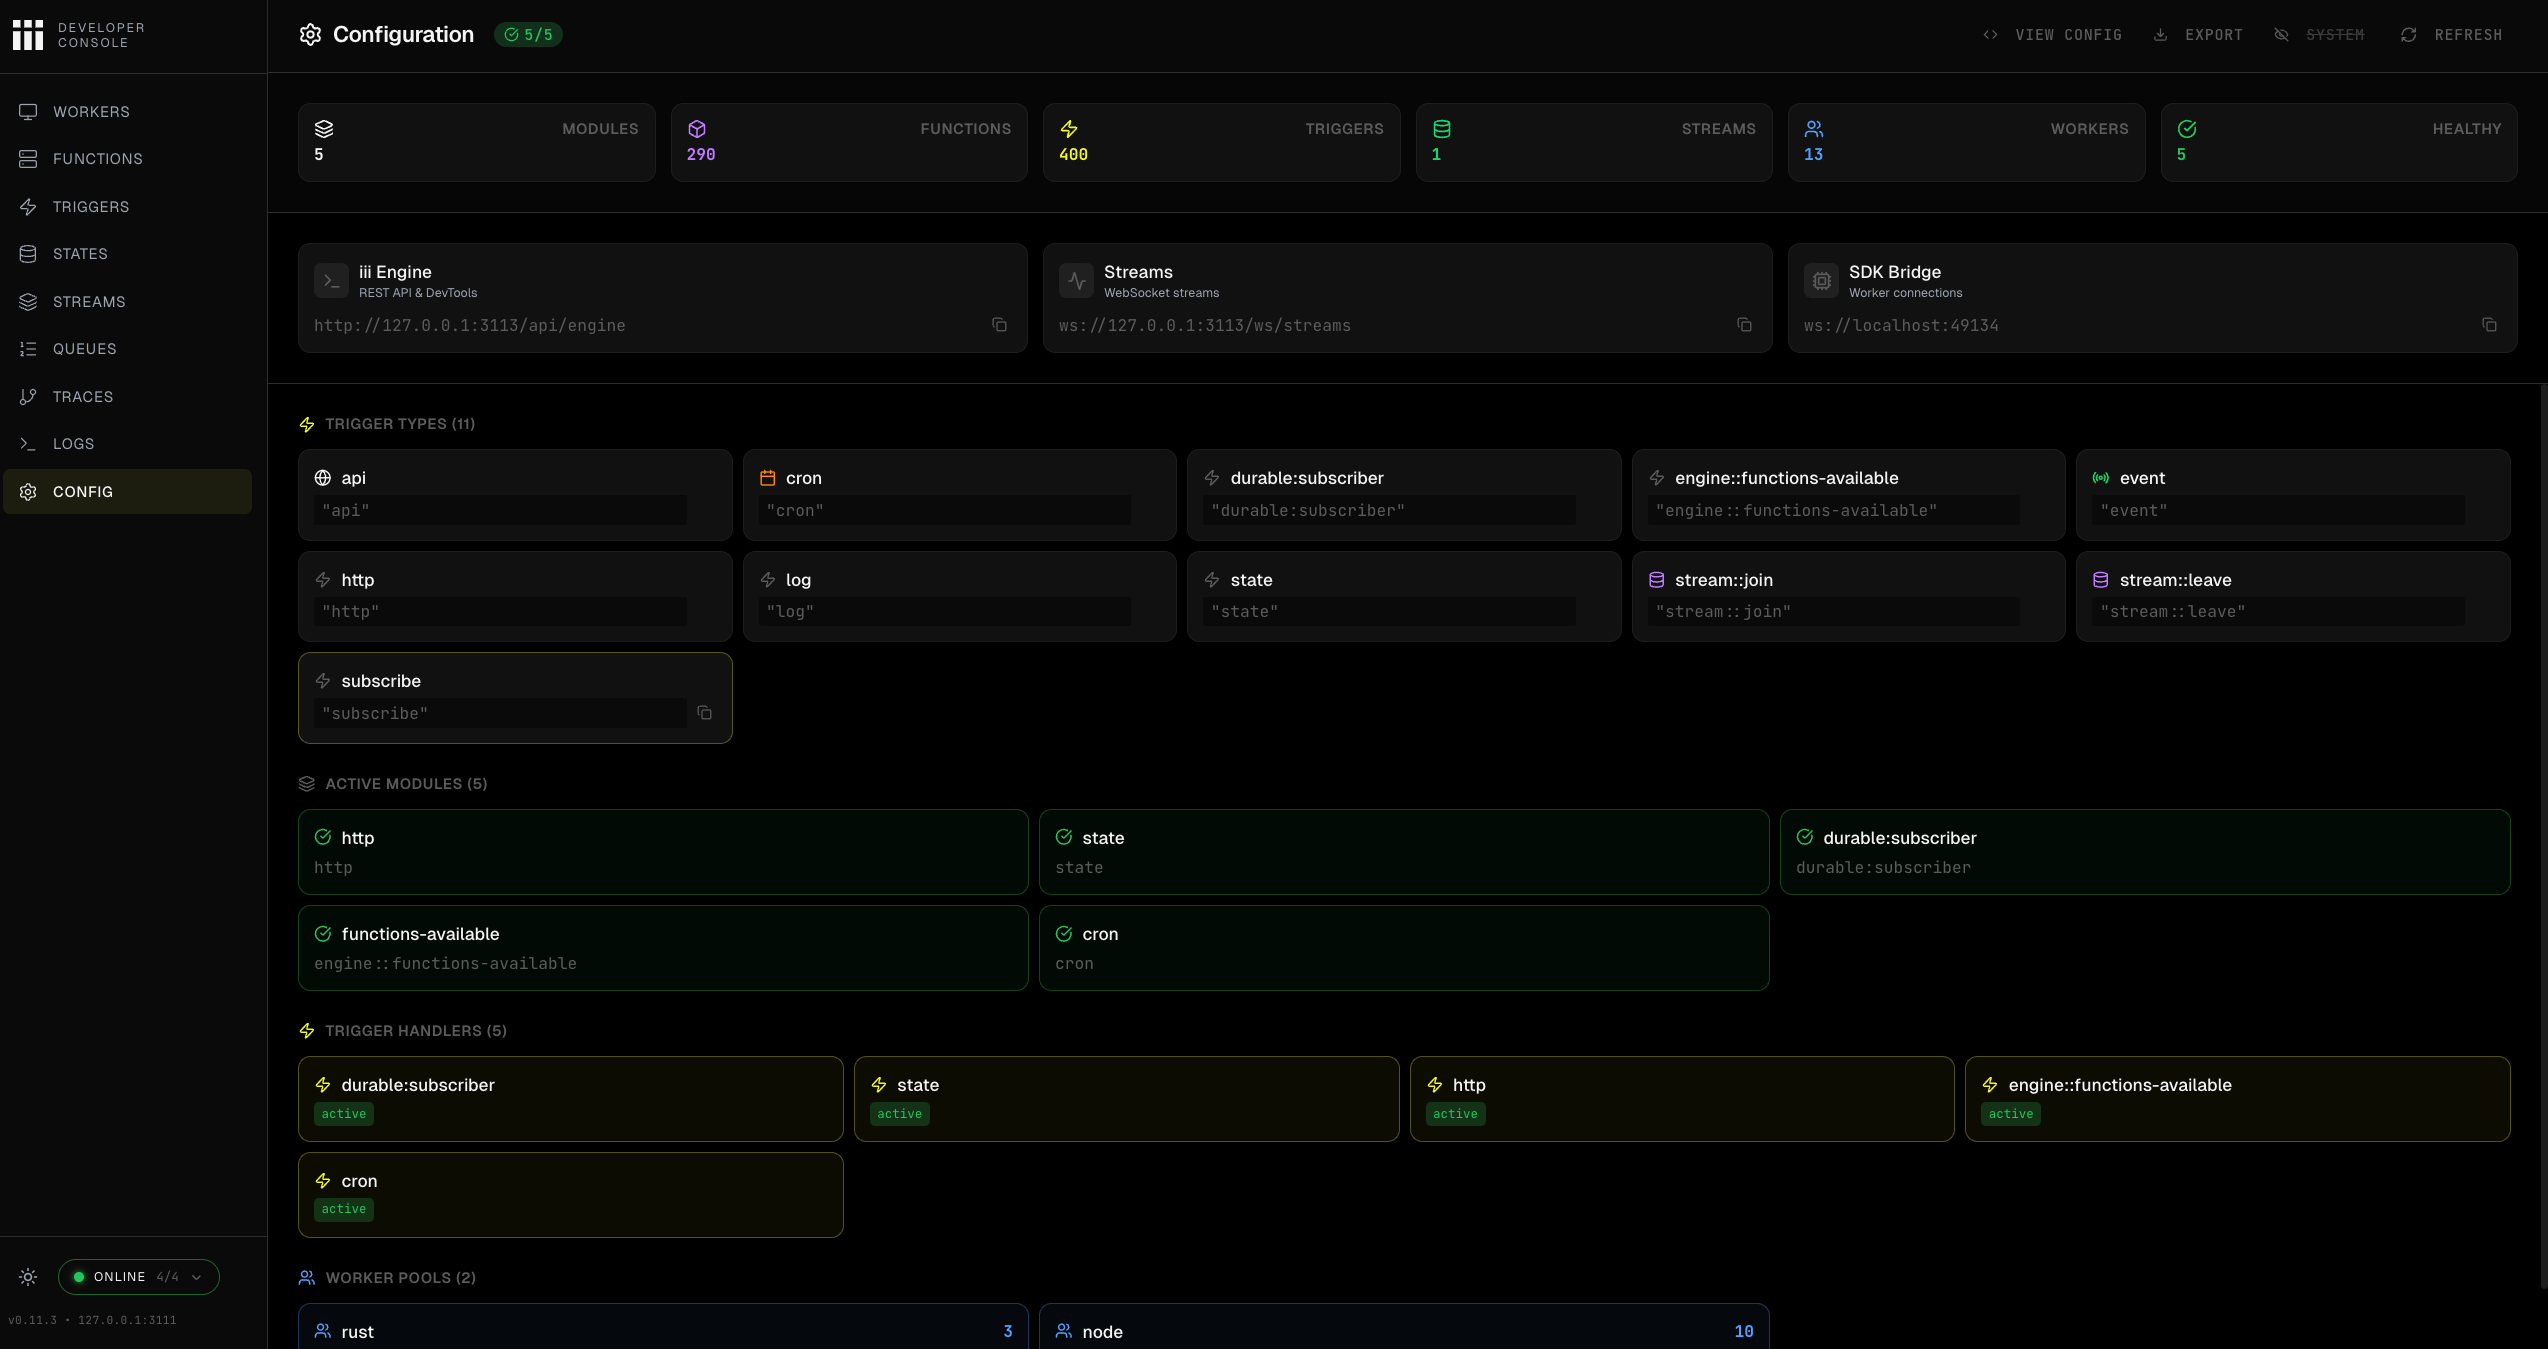
Quick Start
The console comes preinstalled with iii, start it with:Workers
The Workers page lists every worker process currently connected to the engine, with live metrics (memory, CPU, event-loop lag), connection time, active invocations, and registered functions.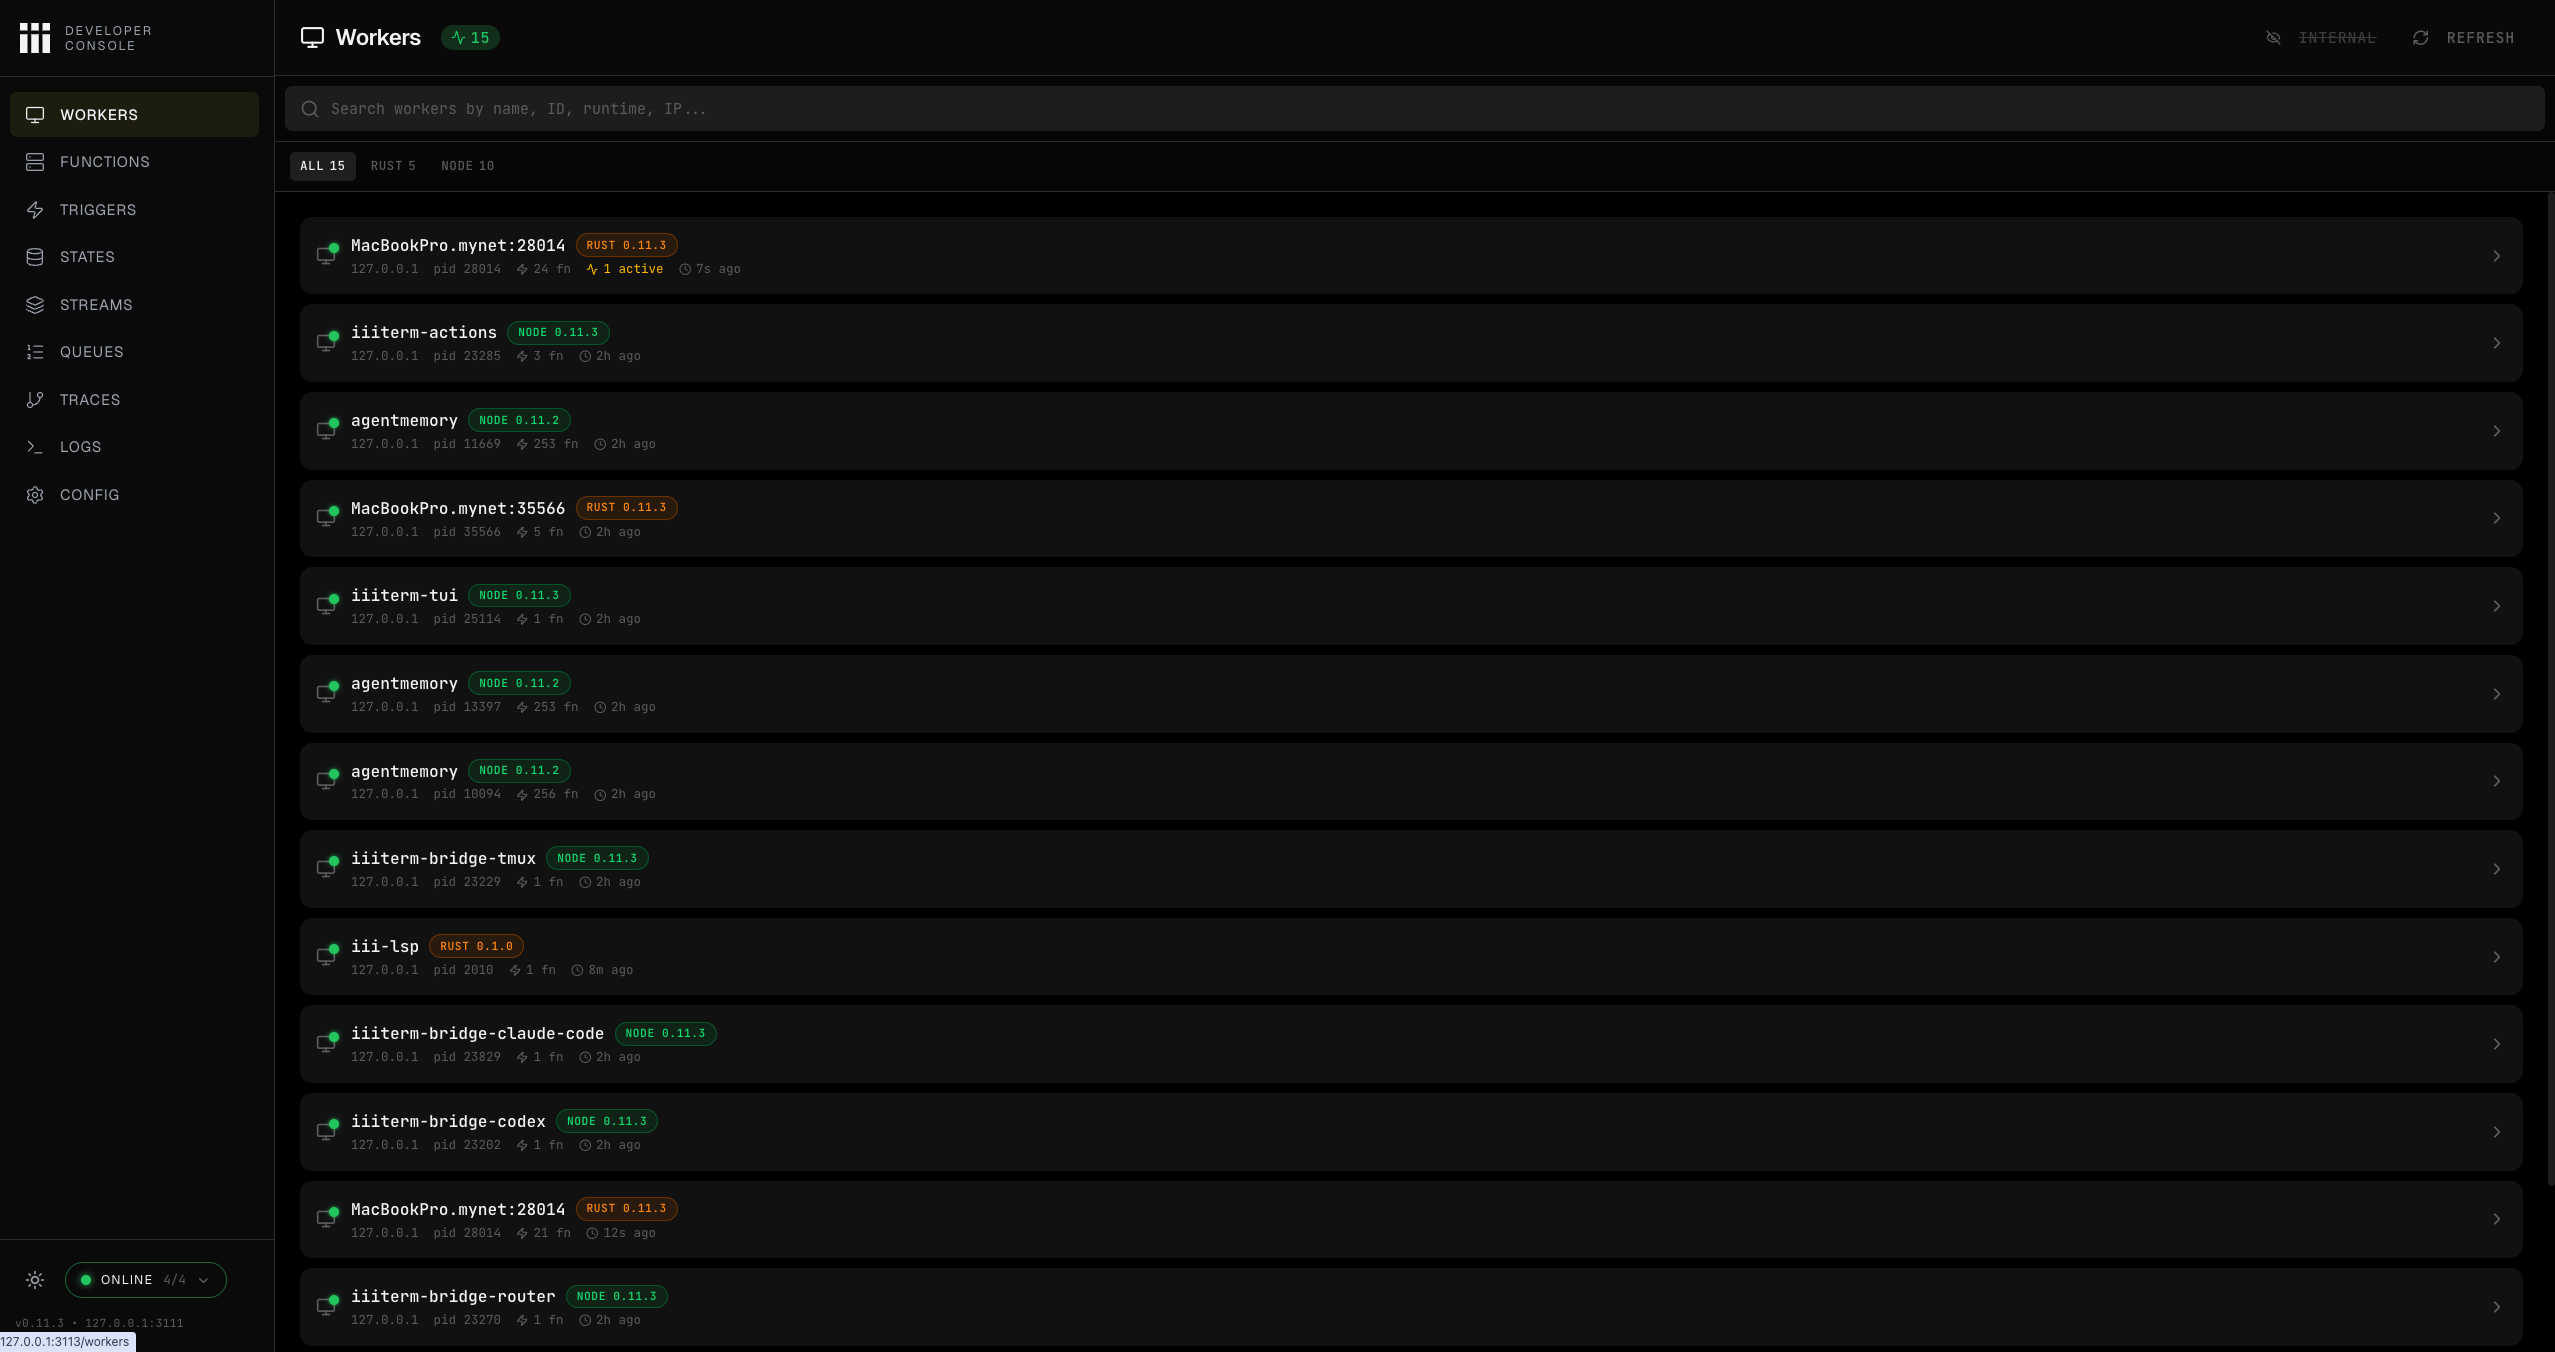
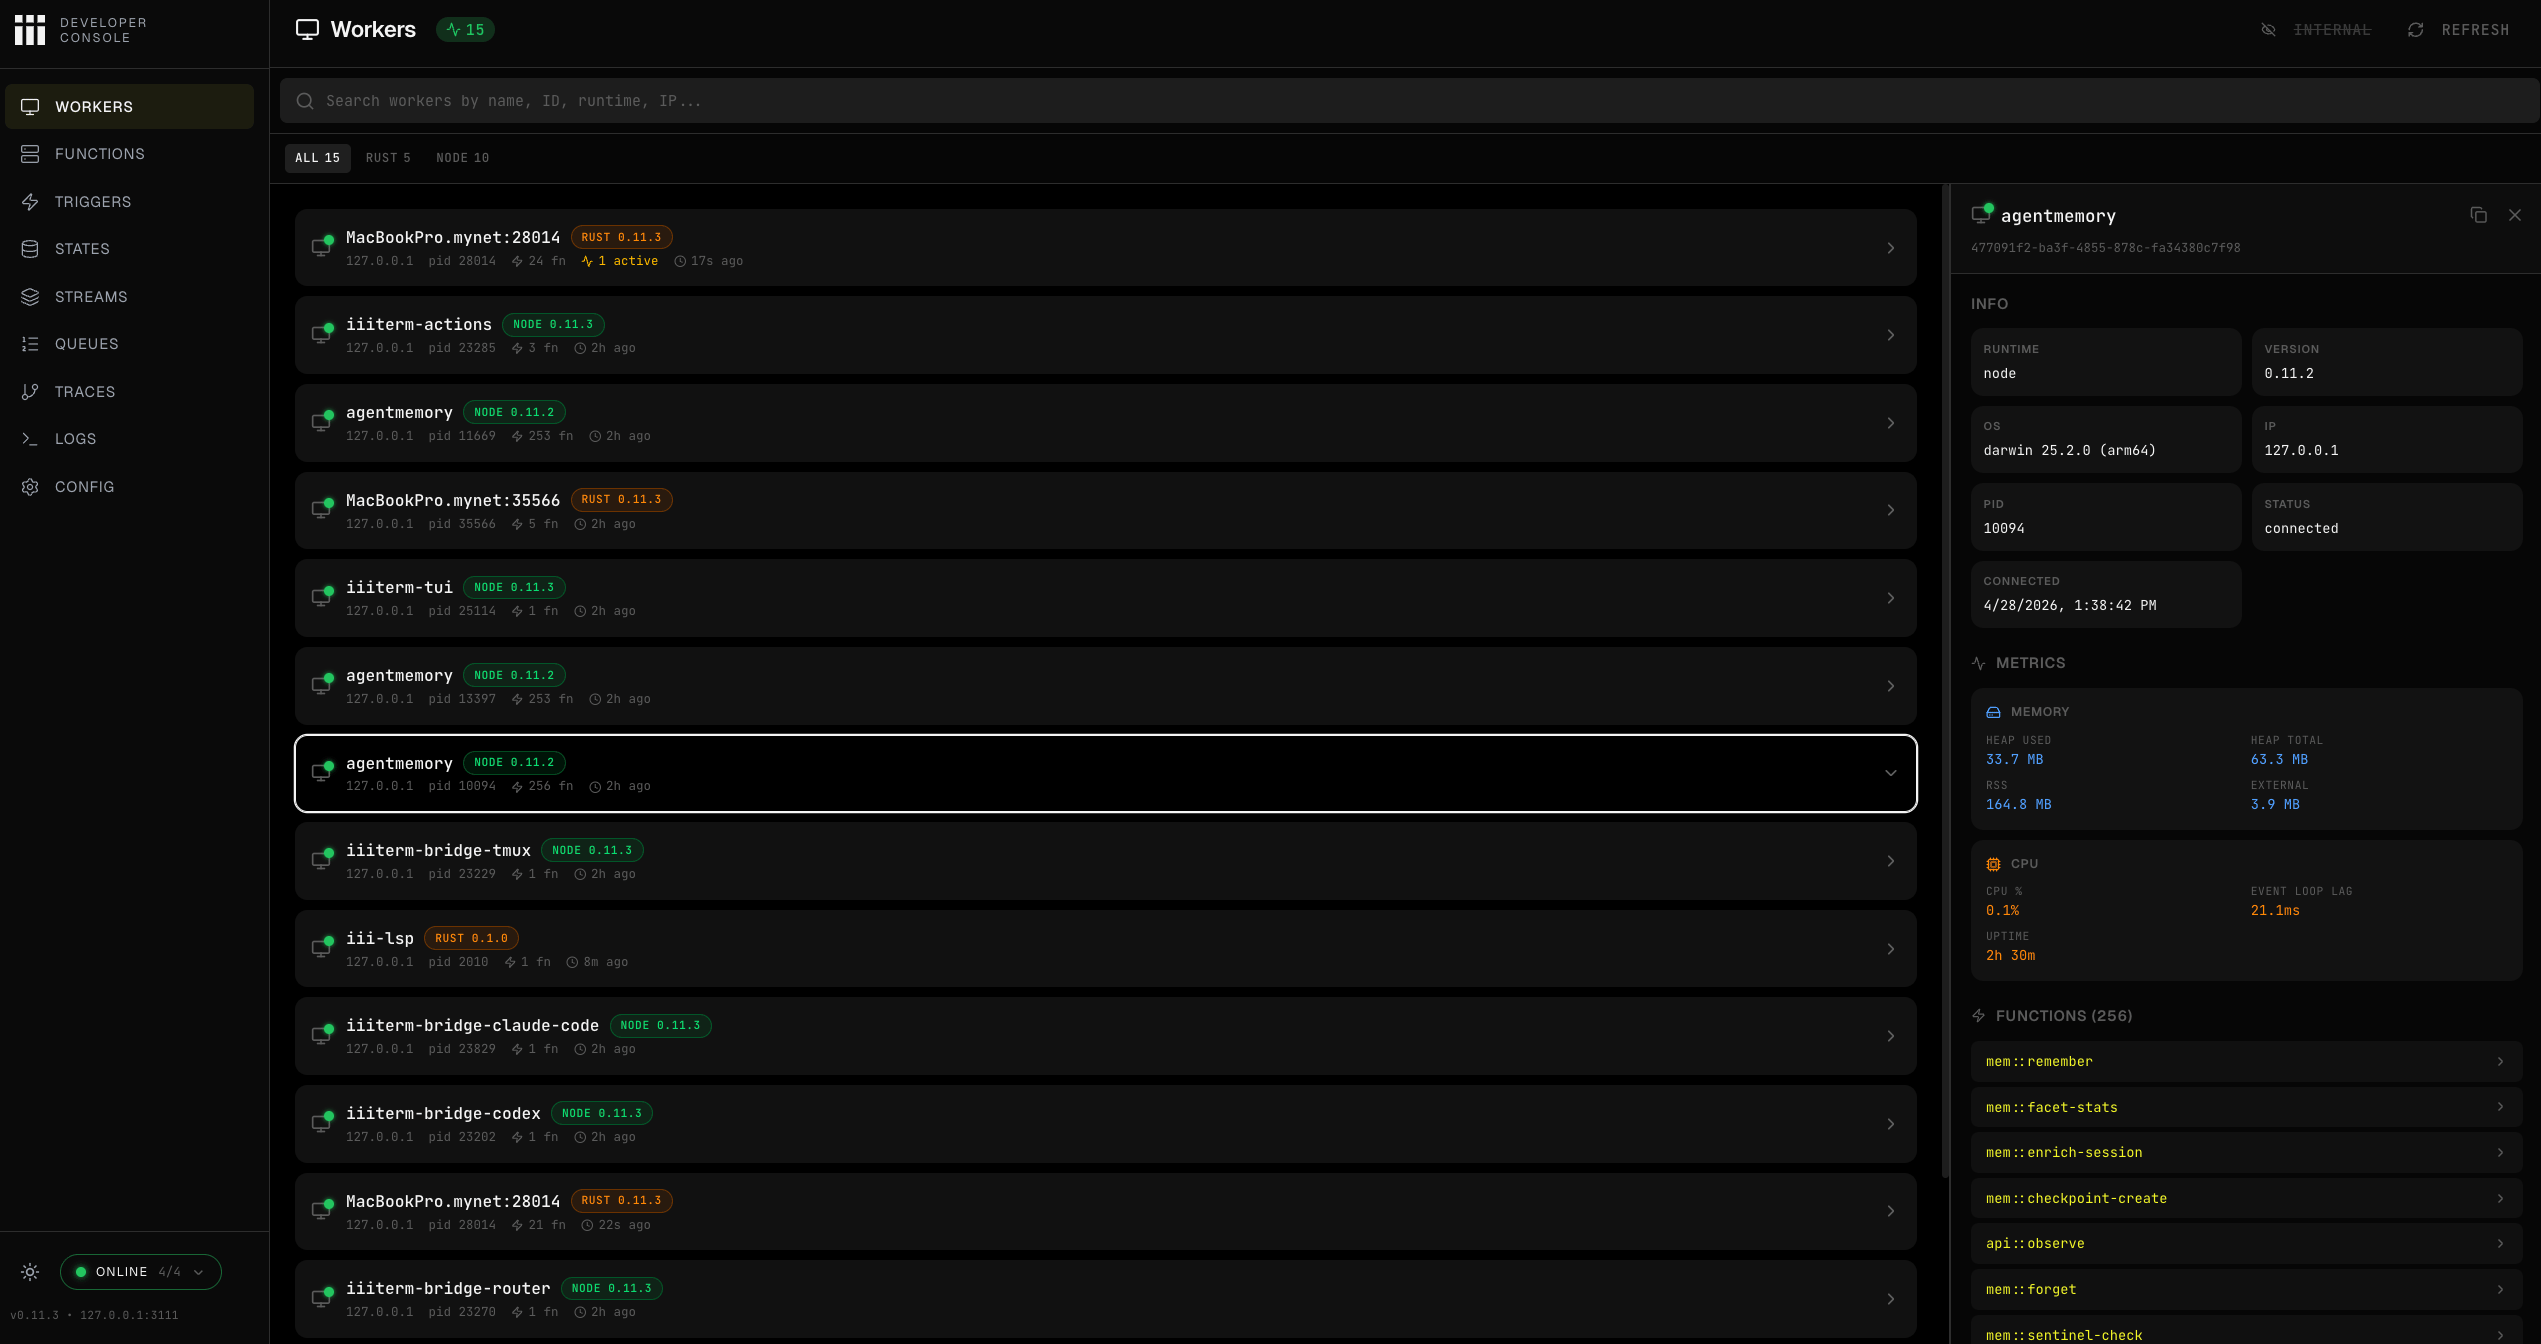
The worker detail panel shows full metadata, telemetry (language, project, framework), live metrics, and the list of functions the worker has registered.
Workers launched via
iii worker add ./path or iii worker add <image> run inside libkrun microVMs. The libkrun launcher builds the VM boot environment and injects III_ISOLATION=libkrun at VM boot time, so you’ll see a purple LIBKRUN badge next to the runtime badge. The badge is descriptive (what the worker reports about its environment), not an attestation — a direct SDK connection can self-set III_ISOLATION=docker (or anything else) before starting. Workers that don’t set the variable show no isolation badge.Functions
The Functions page lists every function registered with the iii engine and lets you invoke any of them directly with custom JSON input.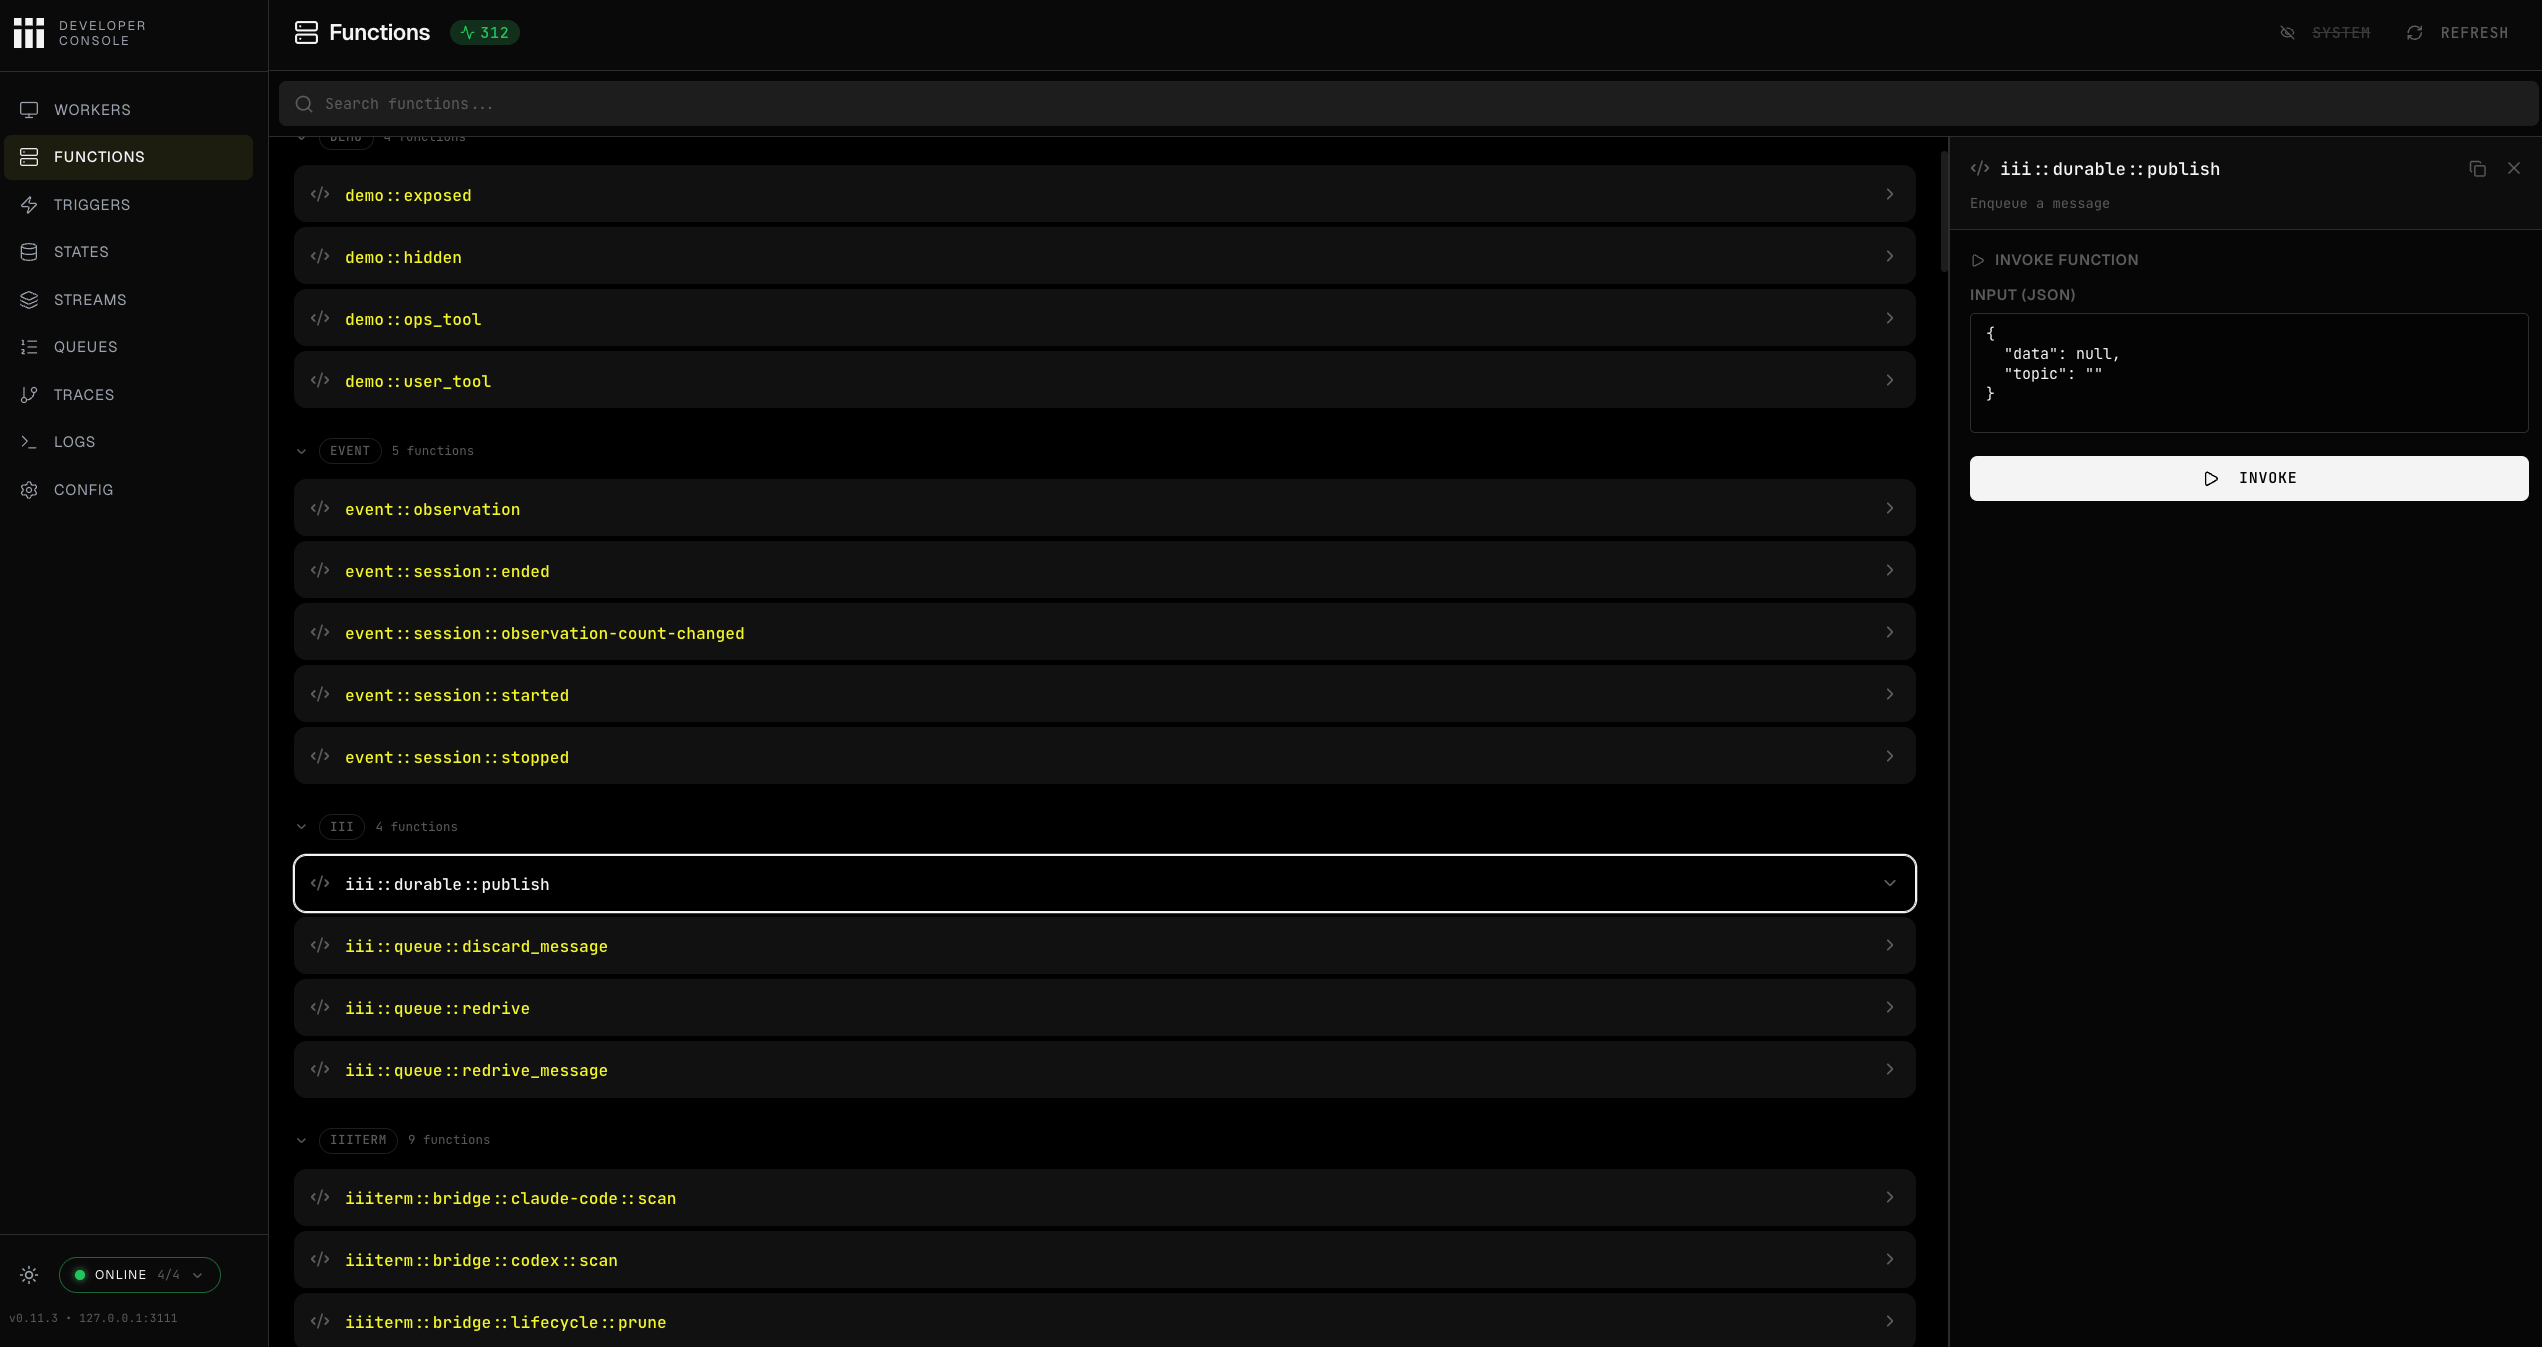
Use the search bar at the top to filter functions by name.
Invoking Functions
The detail panel includes a JSON editor for invoking functions directly. Enter a payload, click Invoke, and view the result inline. The console sends requests viaPOST /_console/invoke.
See Use the Console for step-by-step instructions.
Only functions that are currently registered and connected via an active worker will appear in the list. If a function is missing, check that its worker process is running.
Triggers
The Triggers page shows every trigger registered with the engine and provides interactive tools to test each trigger type. Triggers are grouped by kind (http, cron, event, state) with a total count badge and per-type filter tabs.
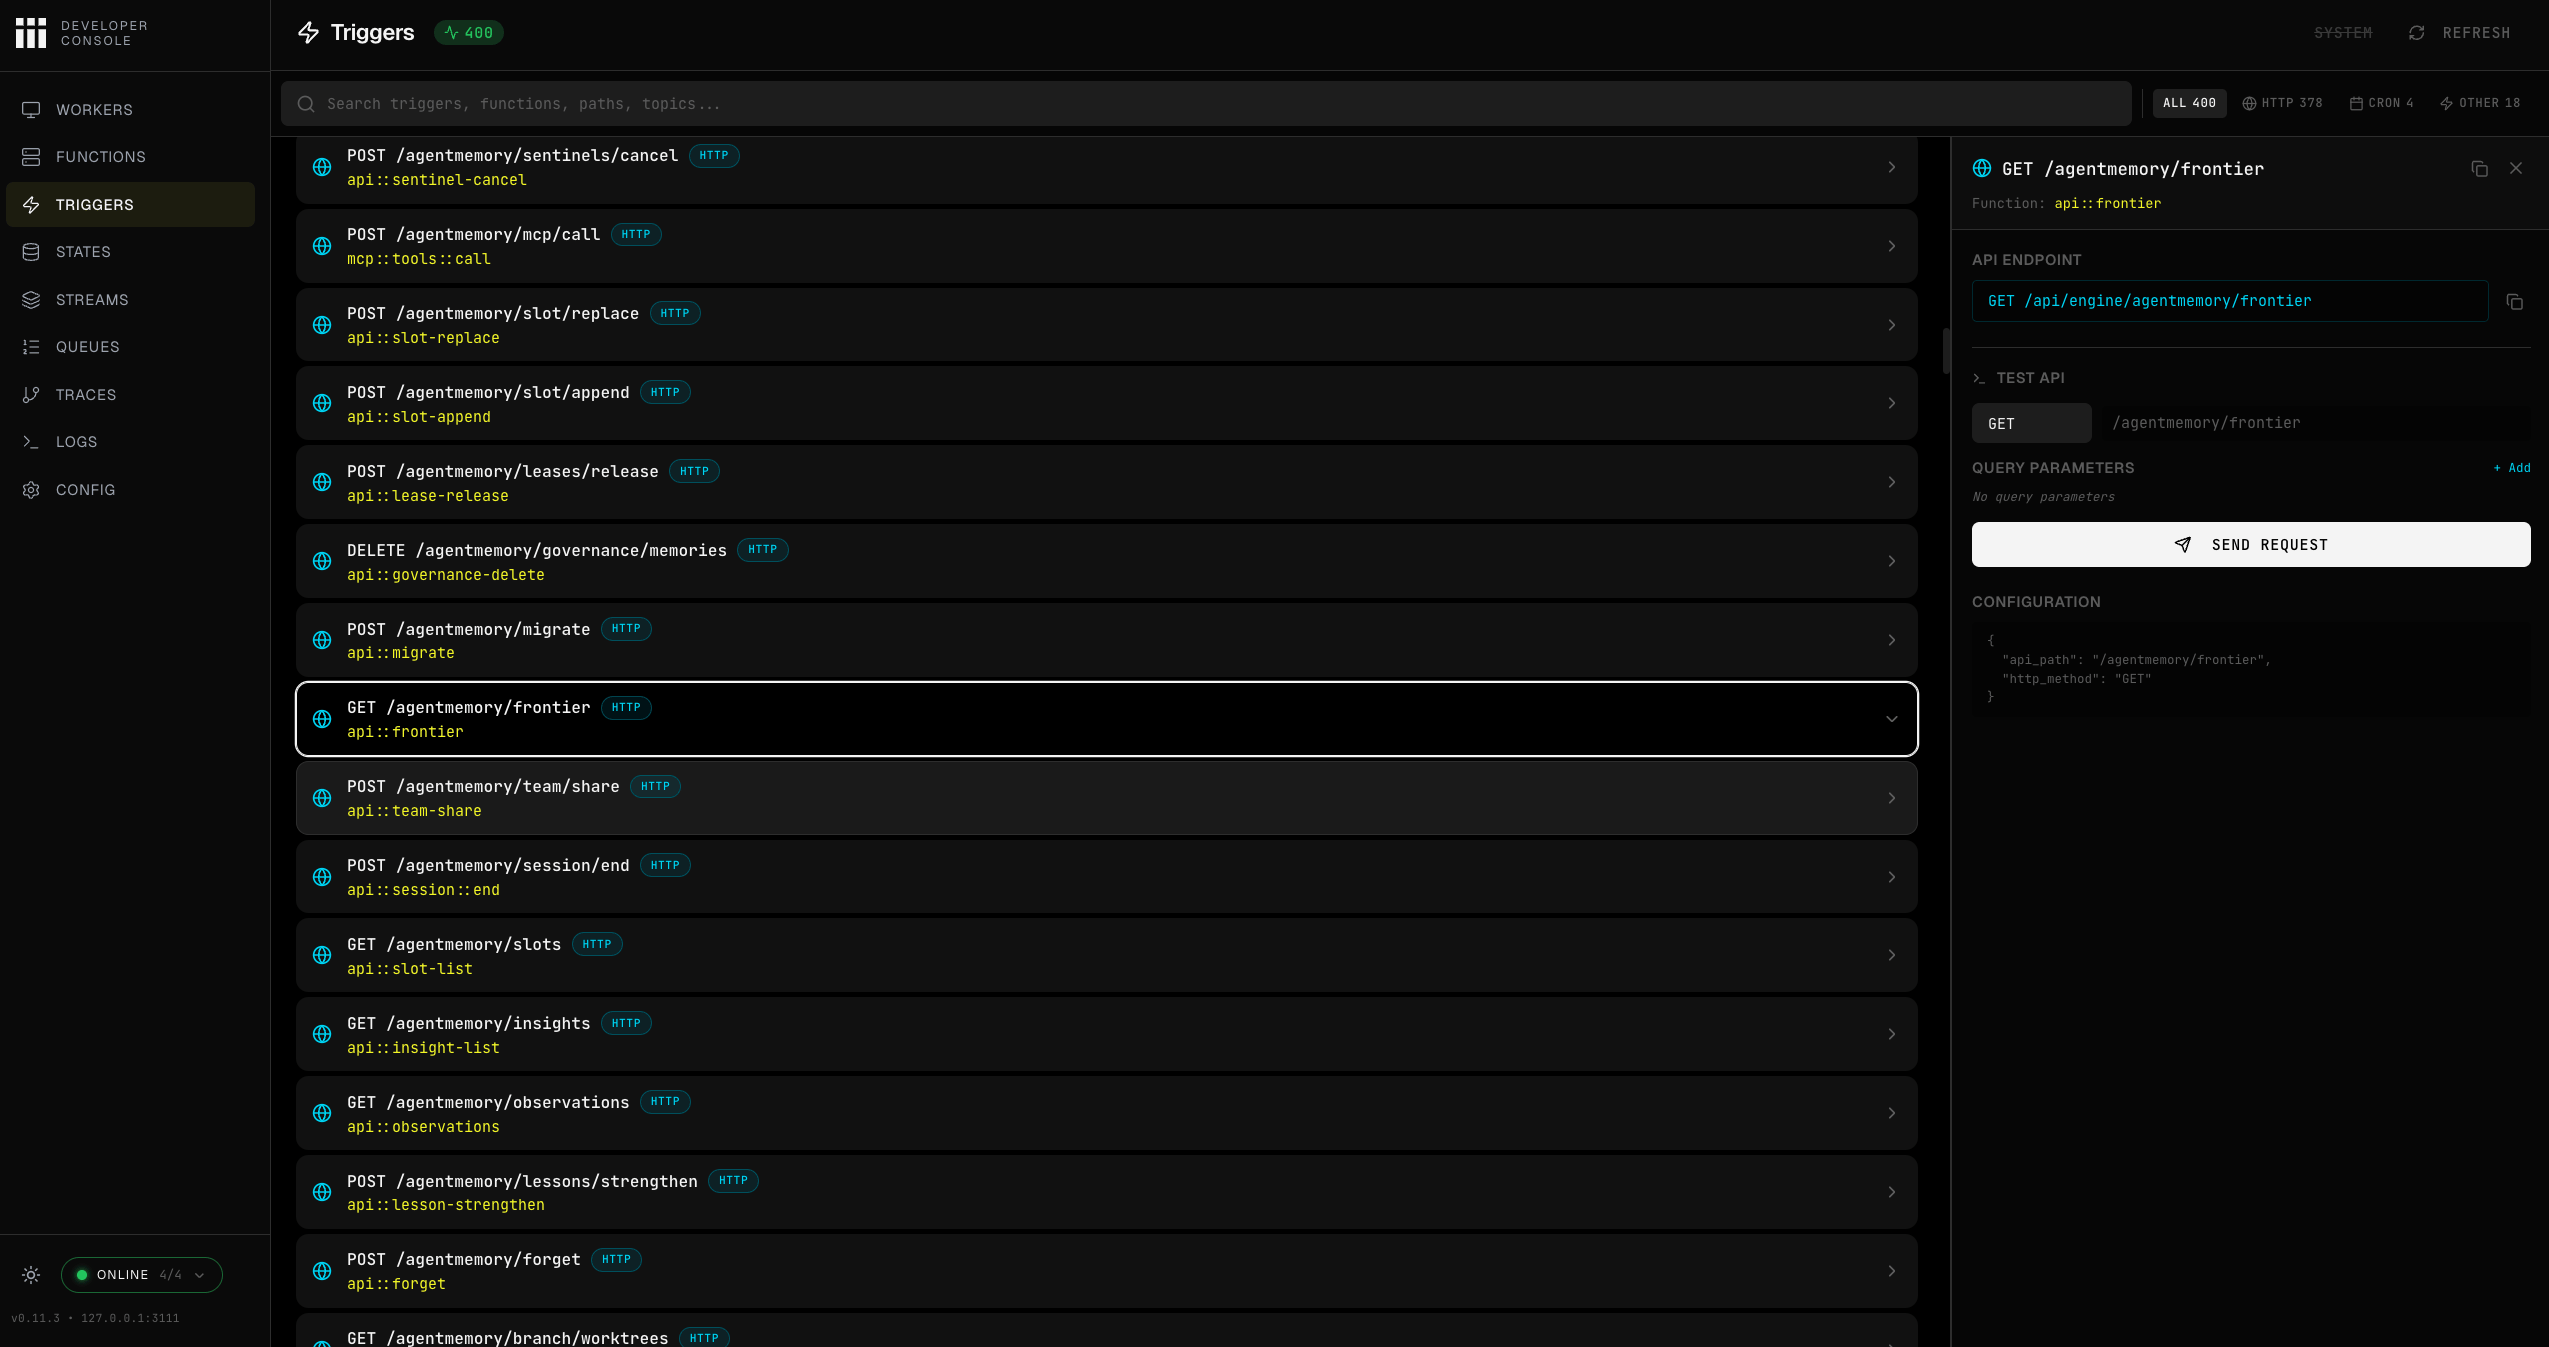
Testing Triggers
The console provides interactive testing tools for each trigger type:See Use the Console for step-by-step instructions on testing each trigger type.
The available trigger types depend on which workers are loaded in your engine configuration. See Trigger Types and Workers for the full list.
States
The States page provides a browser for the engine’s key-value state store. You can view, create, edit, and delete state entries organized by scope. The layout is divided into three panels: a group list on the left, an items table in the center, and a detail sidebar on the right.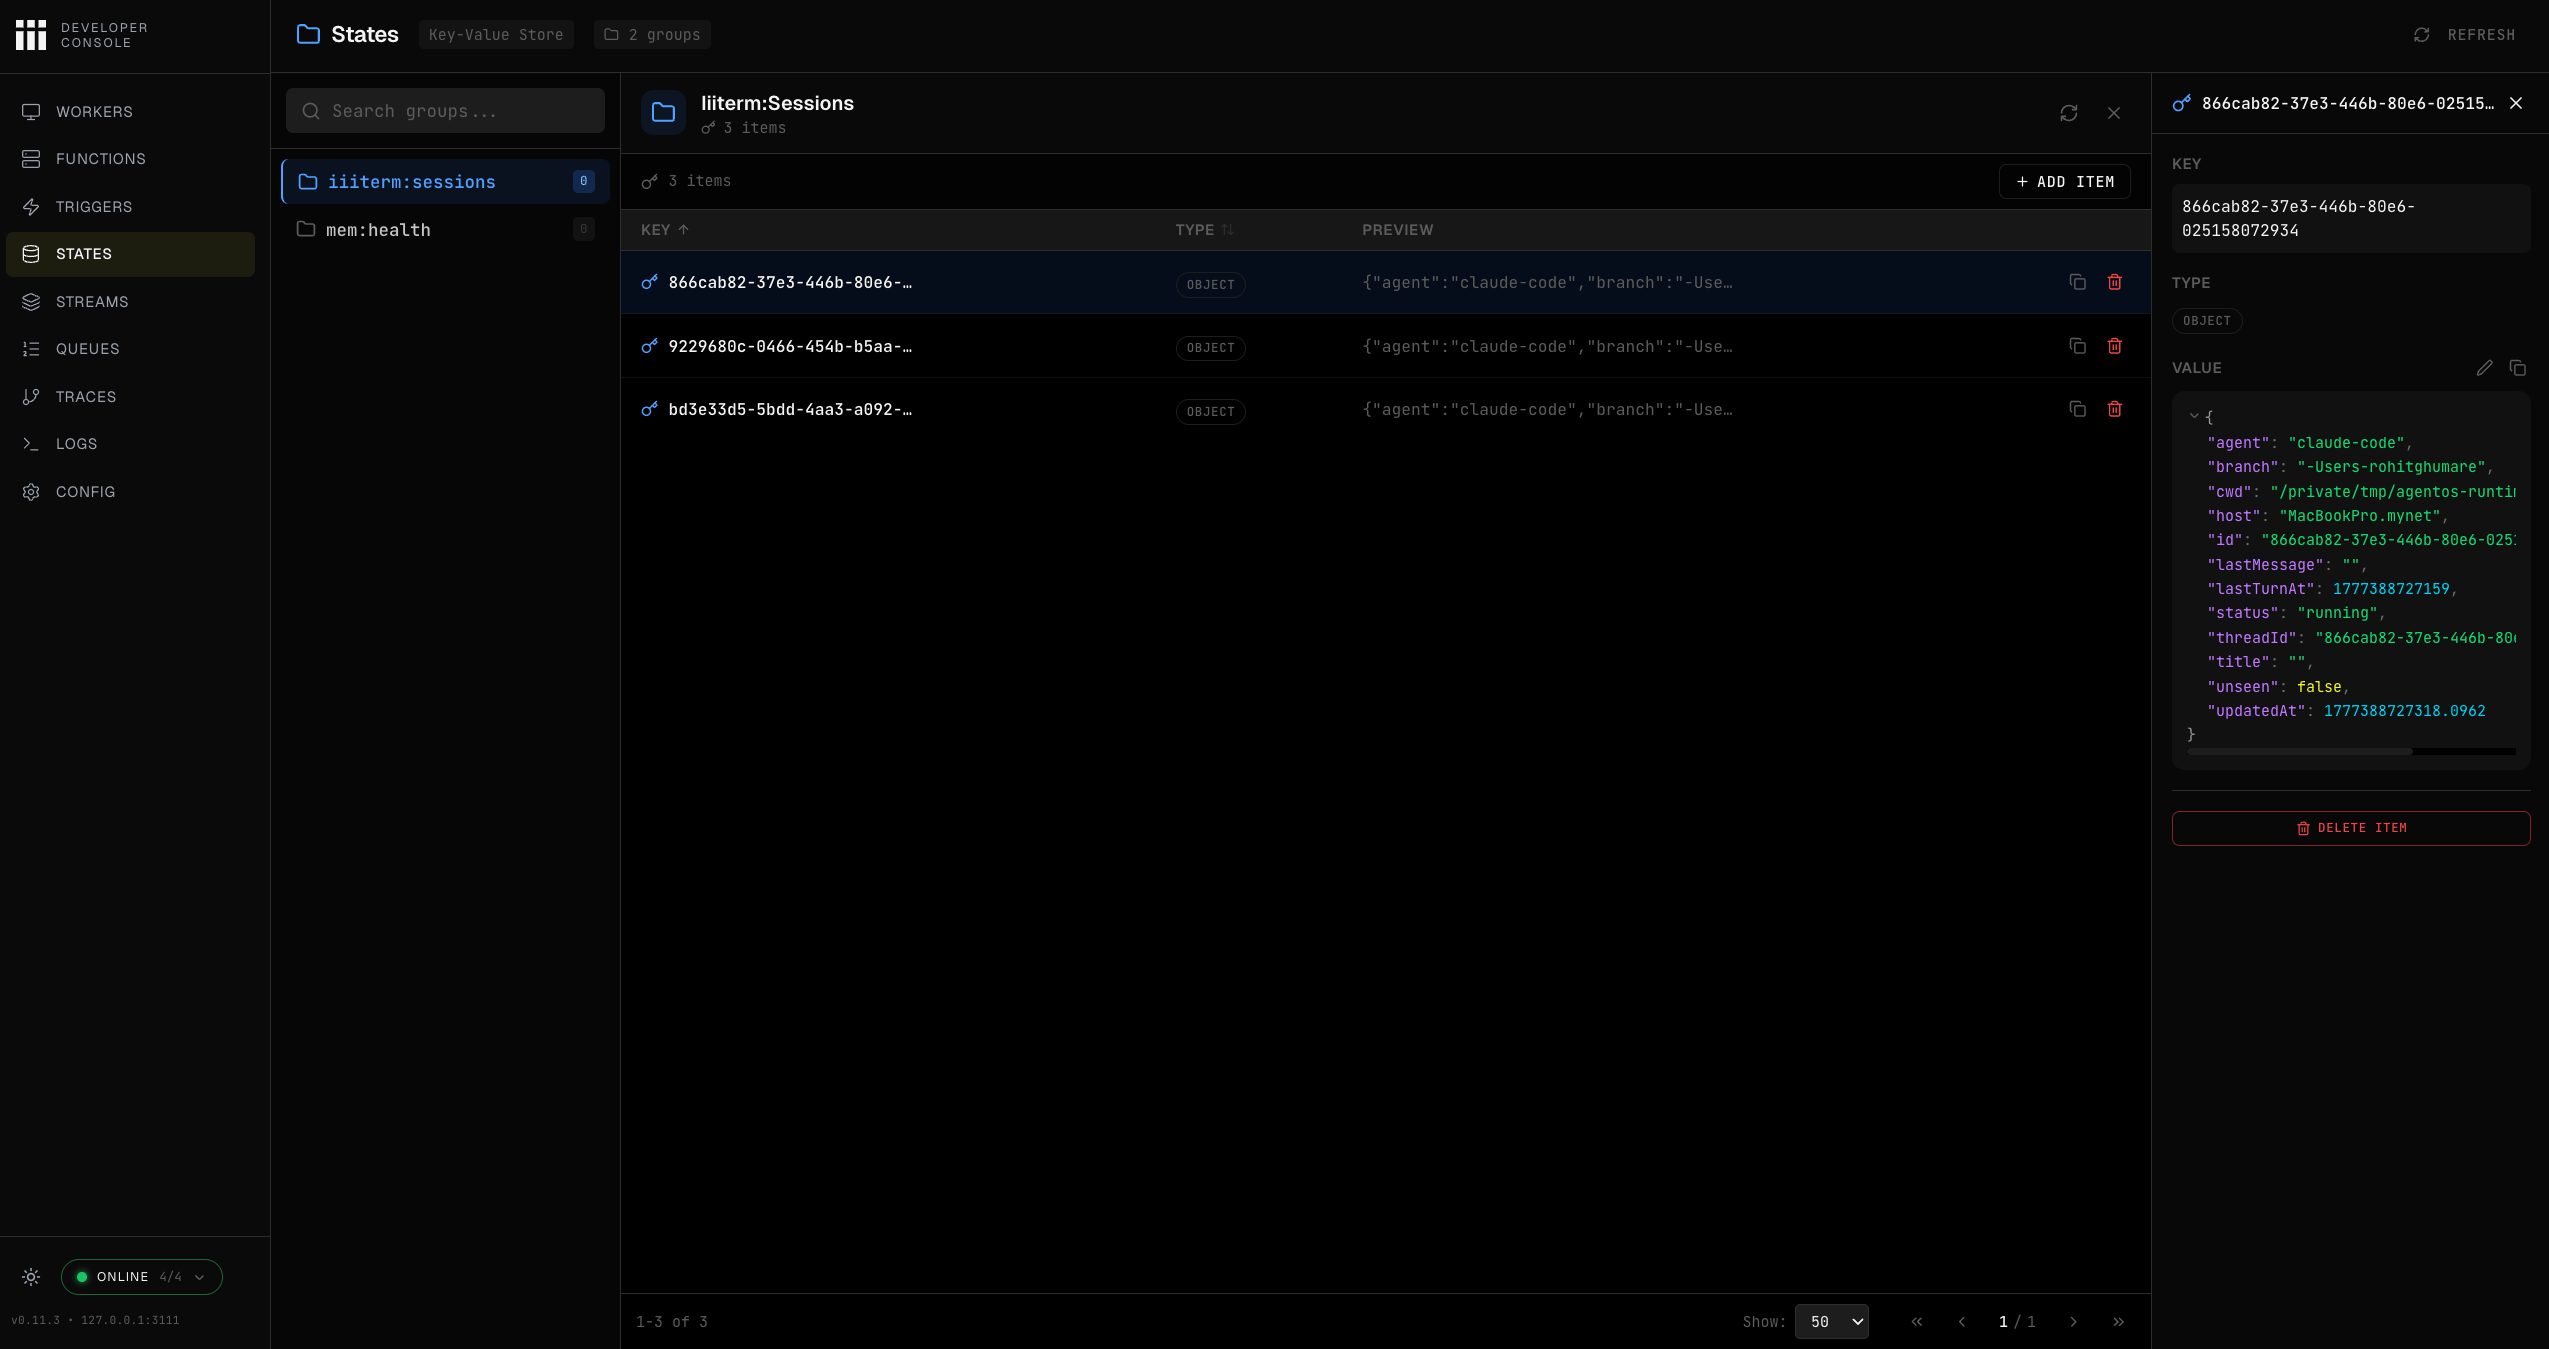
- Groups (Scopes) — top-level namespaces that organize state
- Items — individual key-value pairs within each group
Managing State
The console supports full CRUD operations on state entries:See Use the Console for step-by-step instructions.
State persistence depends on your engine’s State worker configuration. With
in_memory storage, state is lost on engine restart. With file_based or RedisAdapter, state persists across restarts. See State Worker for configuration details.Streams
The Streams page is a live WebSocket monitor that captures messages flowing through the engine’s stream connections. It shows message counters (total, inbound, outbound, and buffer size), subscription management, and direction filter tabs.
Use the filter toggle to show or hide system streams. Streams update in real time via WebSocket.
Streams are provided by the Stream worker. Make sure
iii-stream is included in your engine configuration. See Stream Worker for details.Queues
The Queues page lists durable queue topics, subscriber counts, queued message counts, in-flight work, retry counts, and dead-letter activity.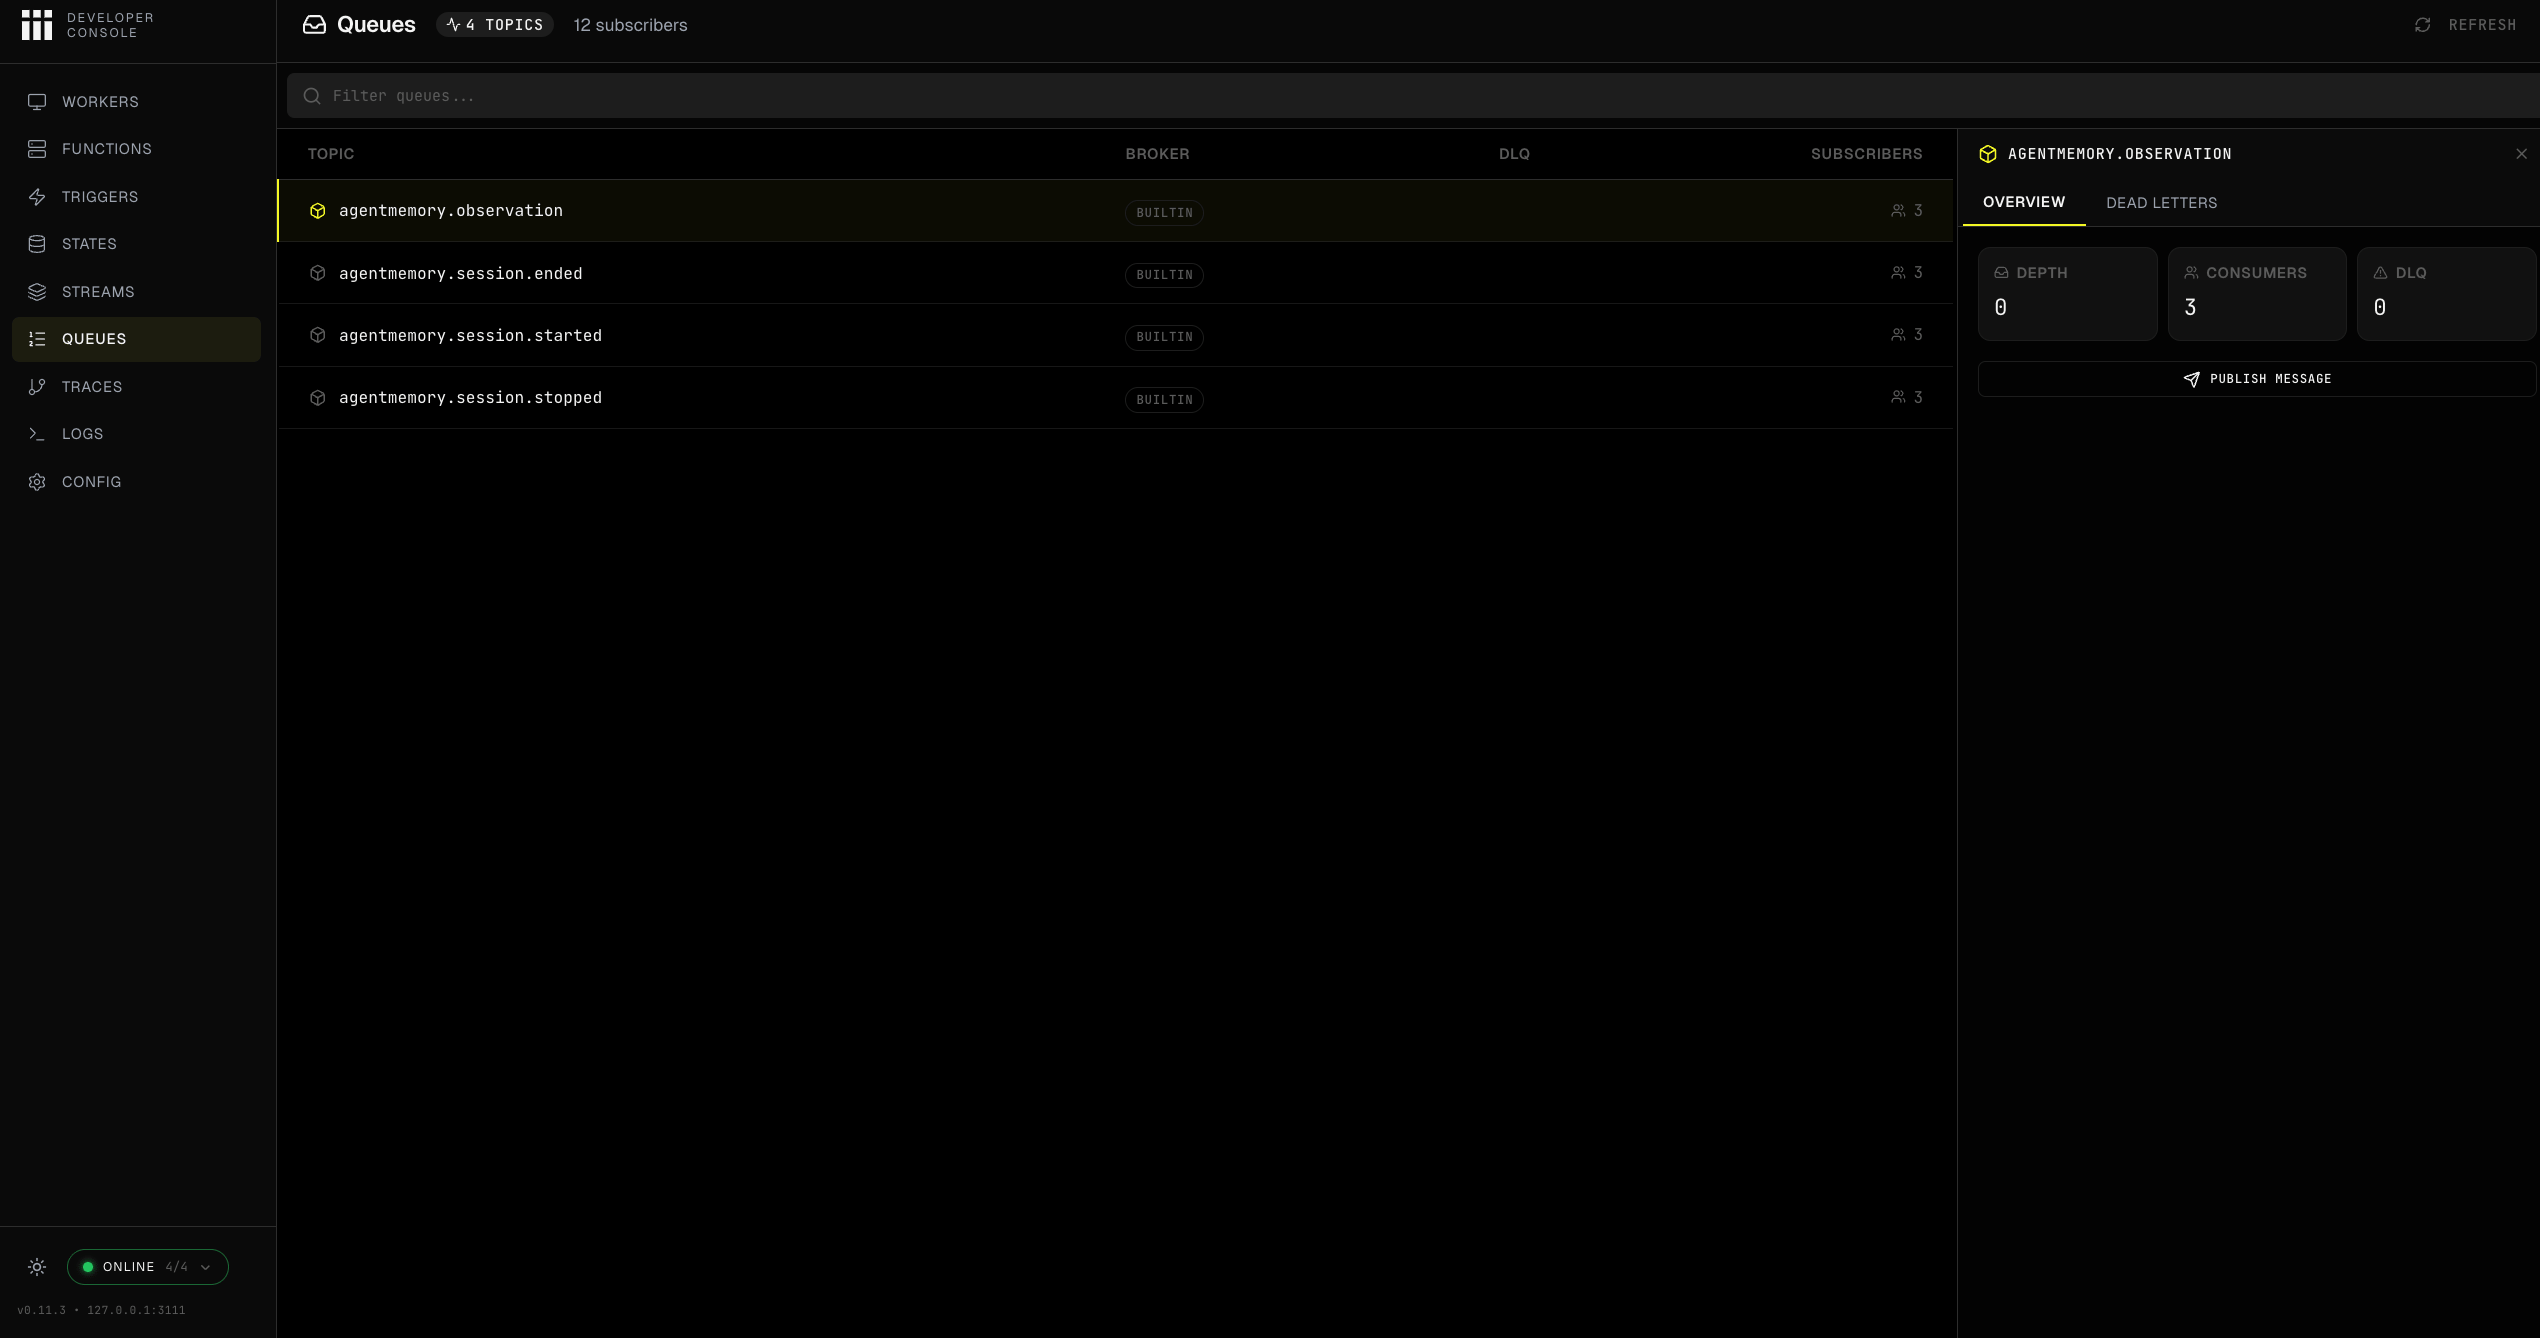
The topic detail panel has two tabs:
See Use the Console for step-by-step instructions on testing queues and managing dead letters.
Traces
The Traces page provides full OpenTelemetry trace visualization with multiple view modes, advanced filtering, and detailed span inspection.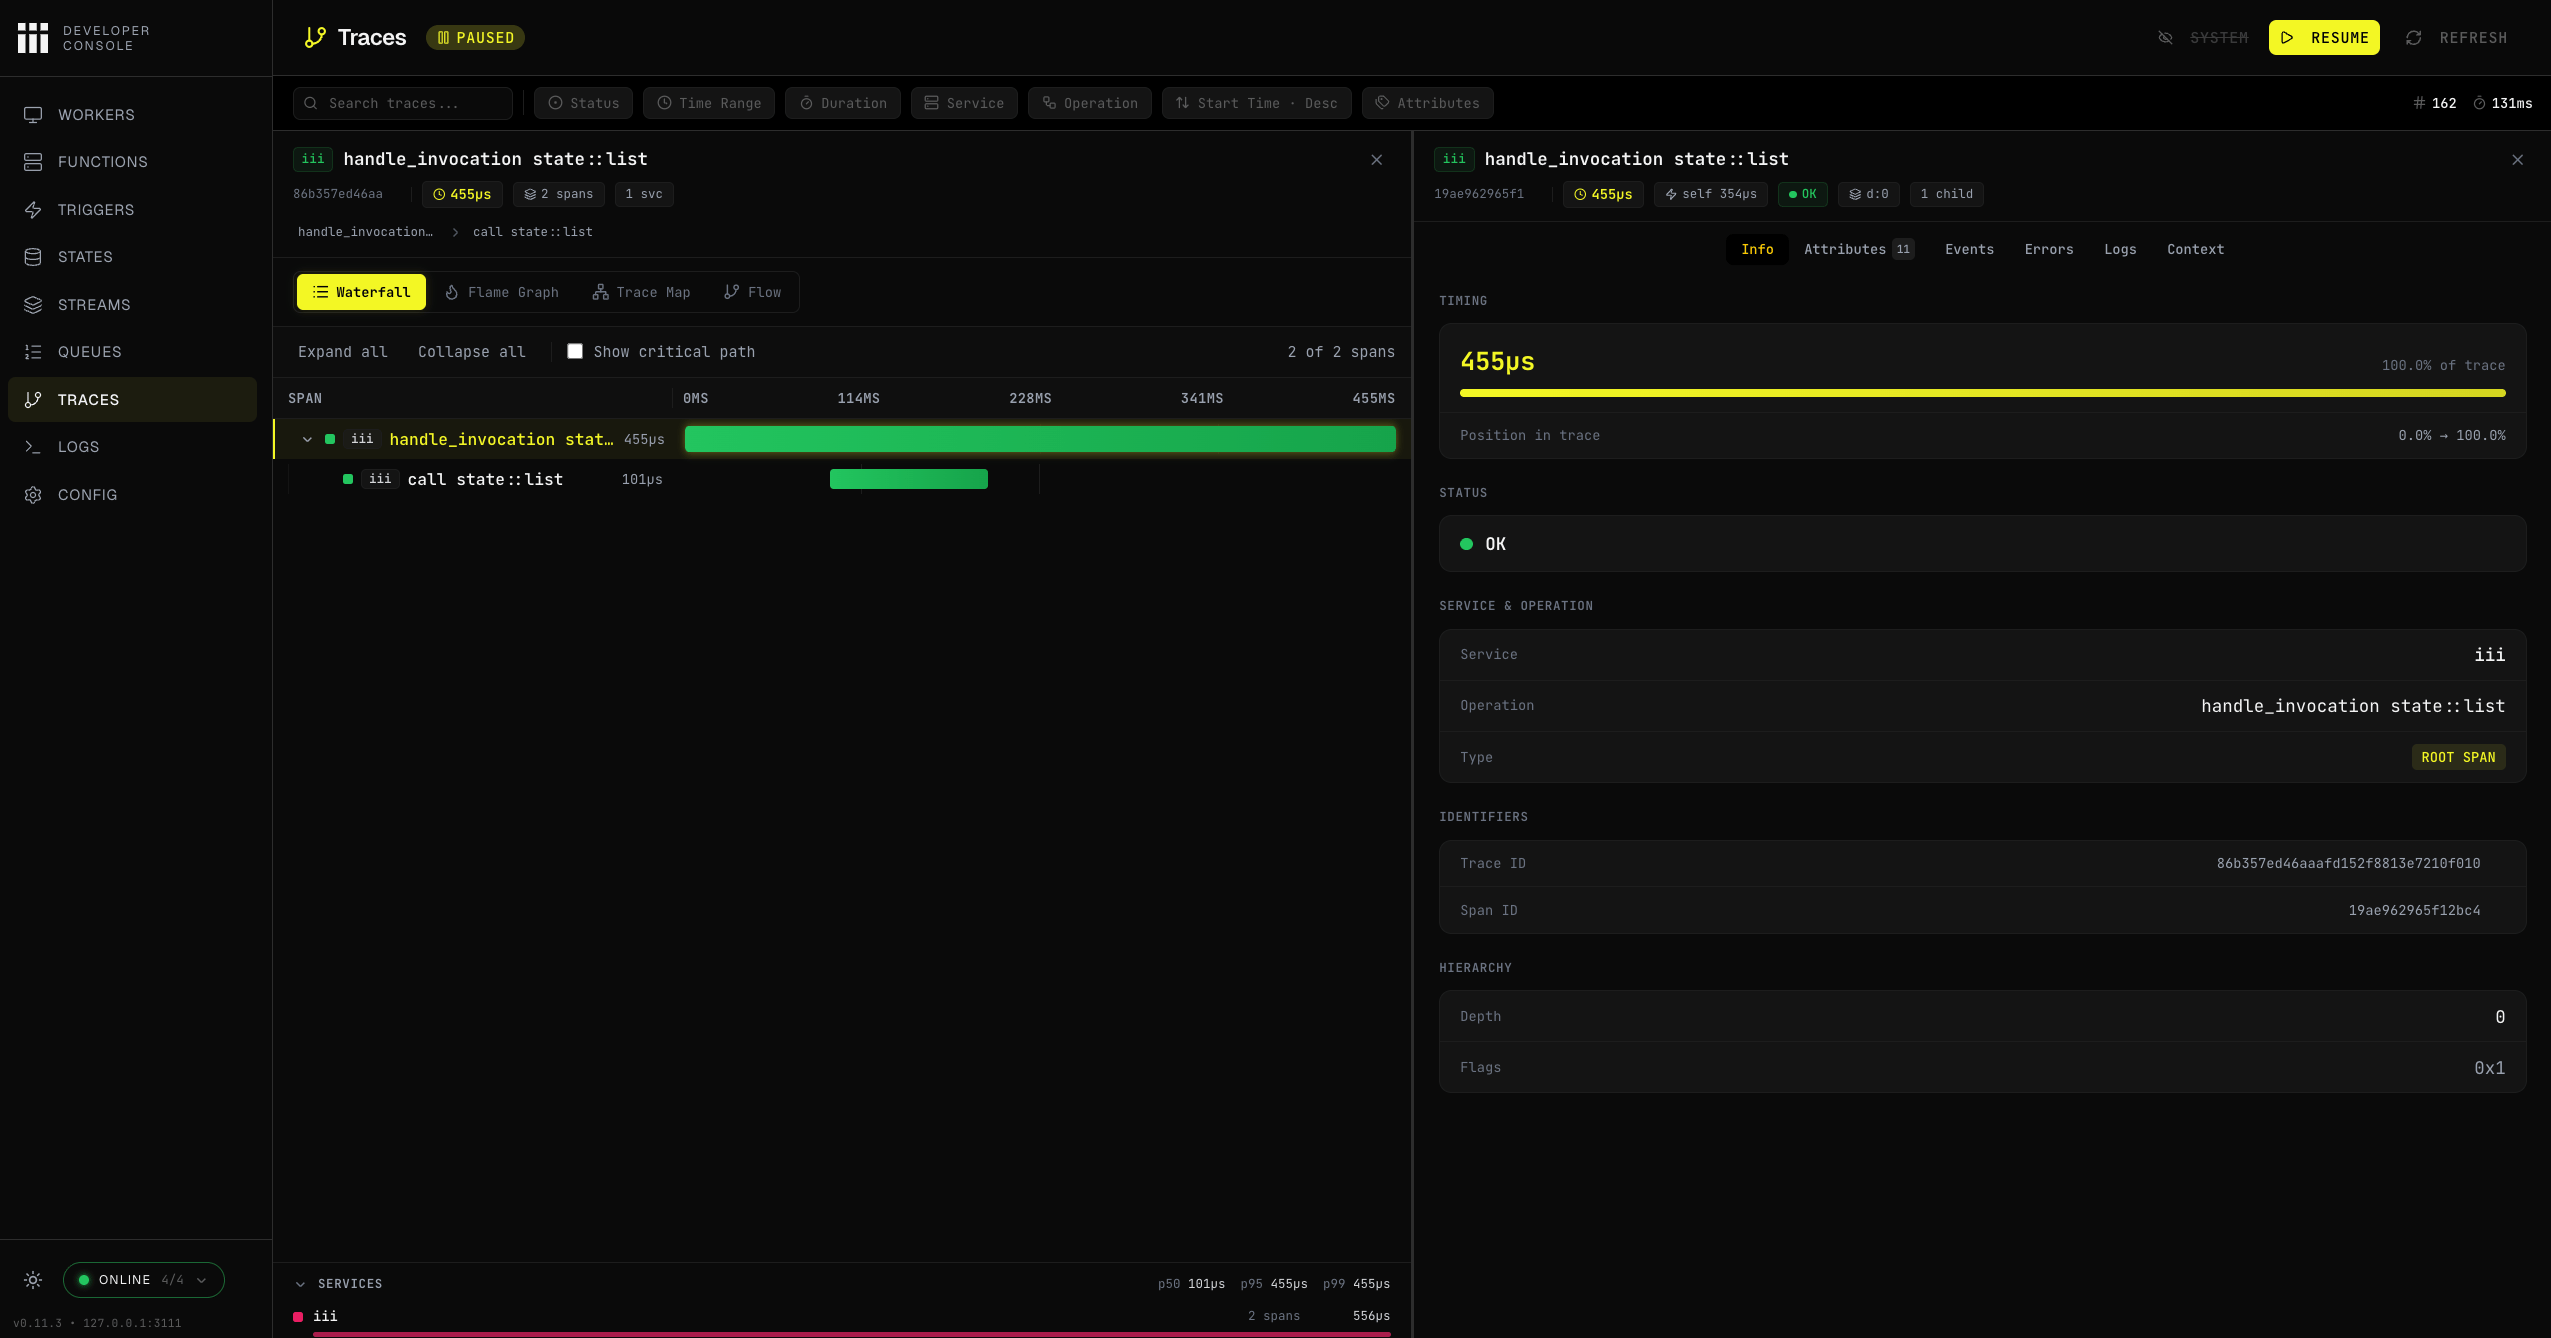
Trace collection requires the Observability worker with
exporter set to memory or both. See Observability Worker for configuration.Trace List
View Modes
The trace detail view provides five visualization modes: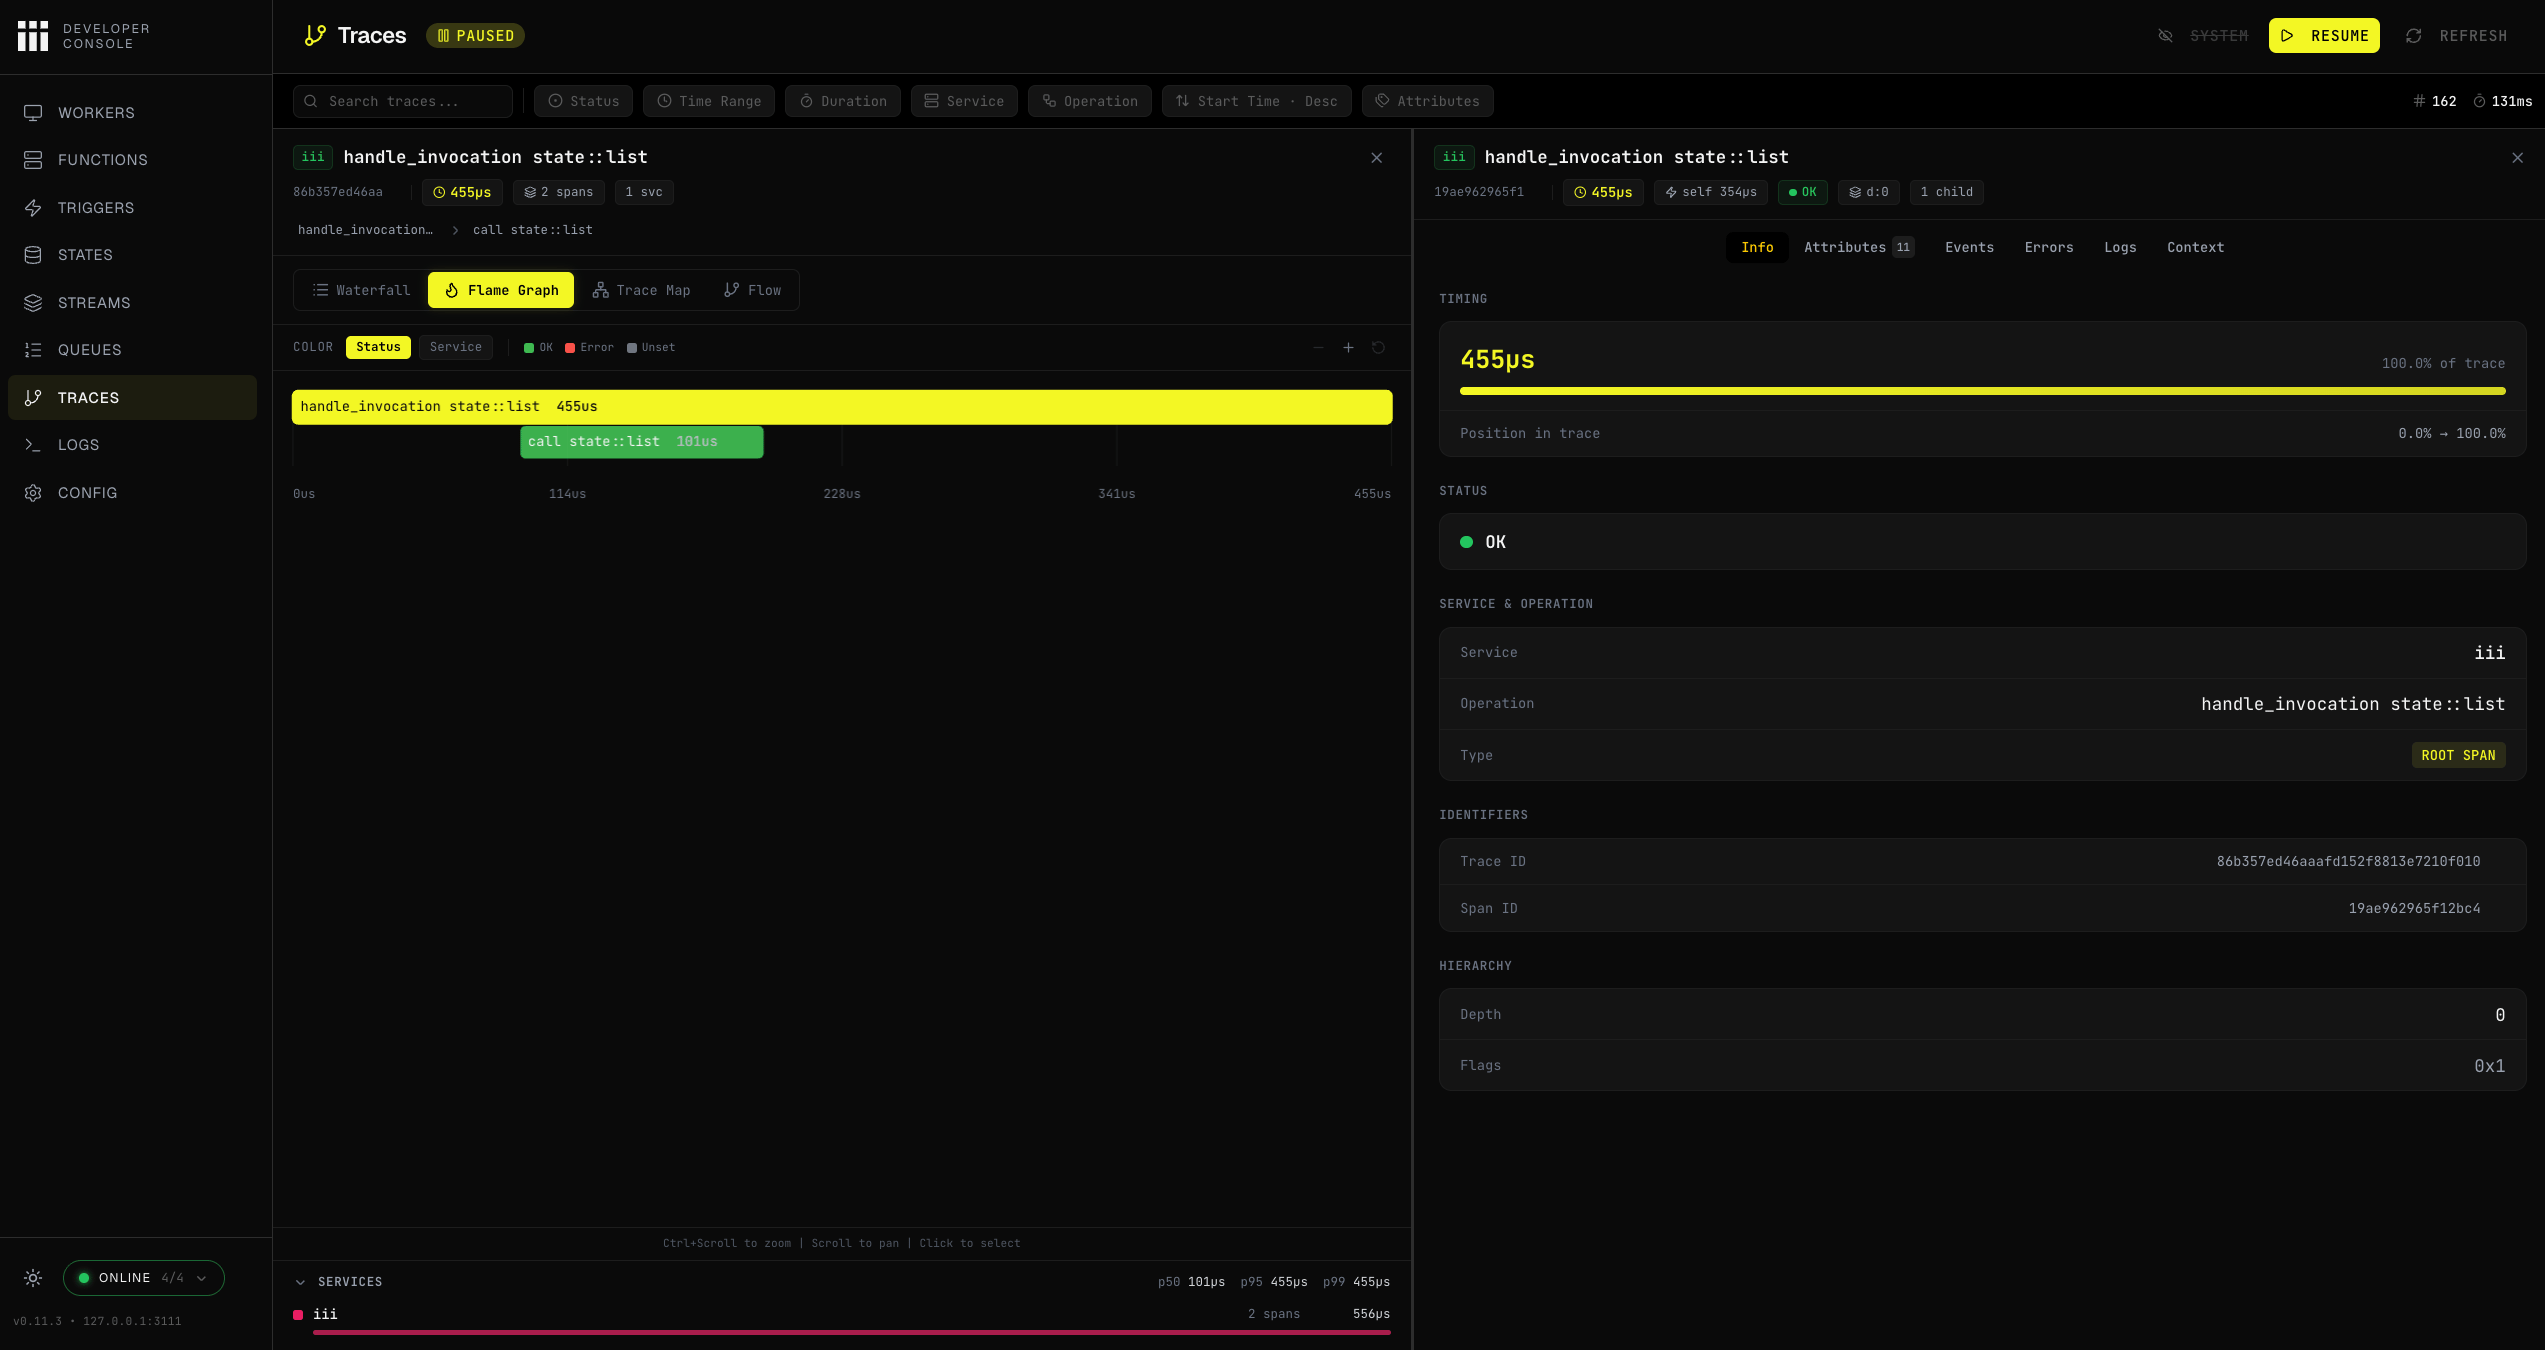
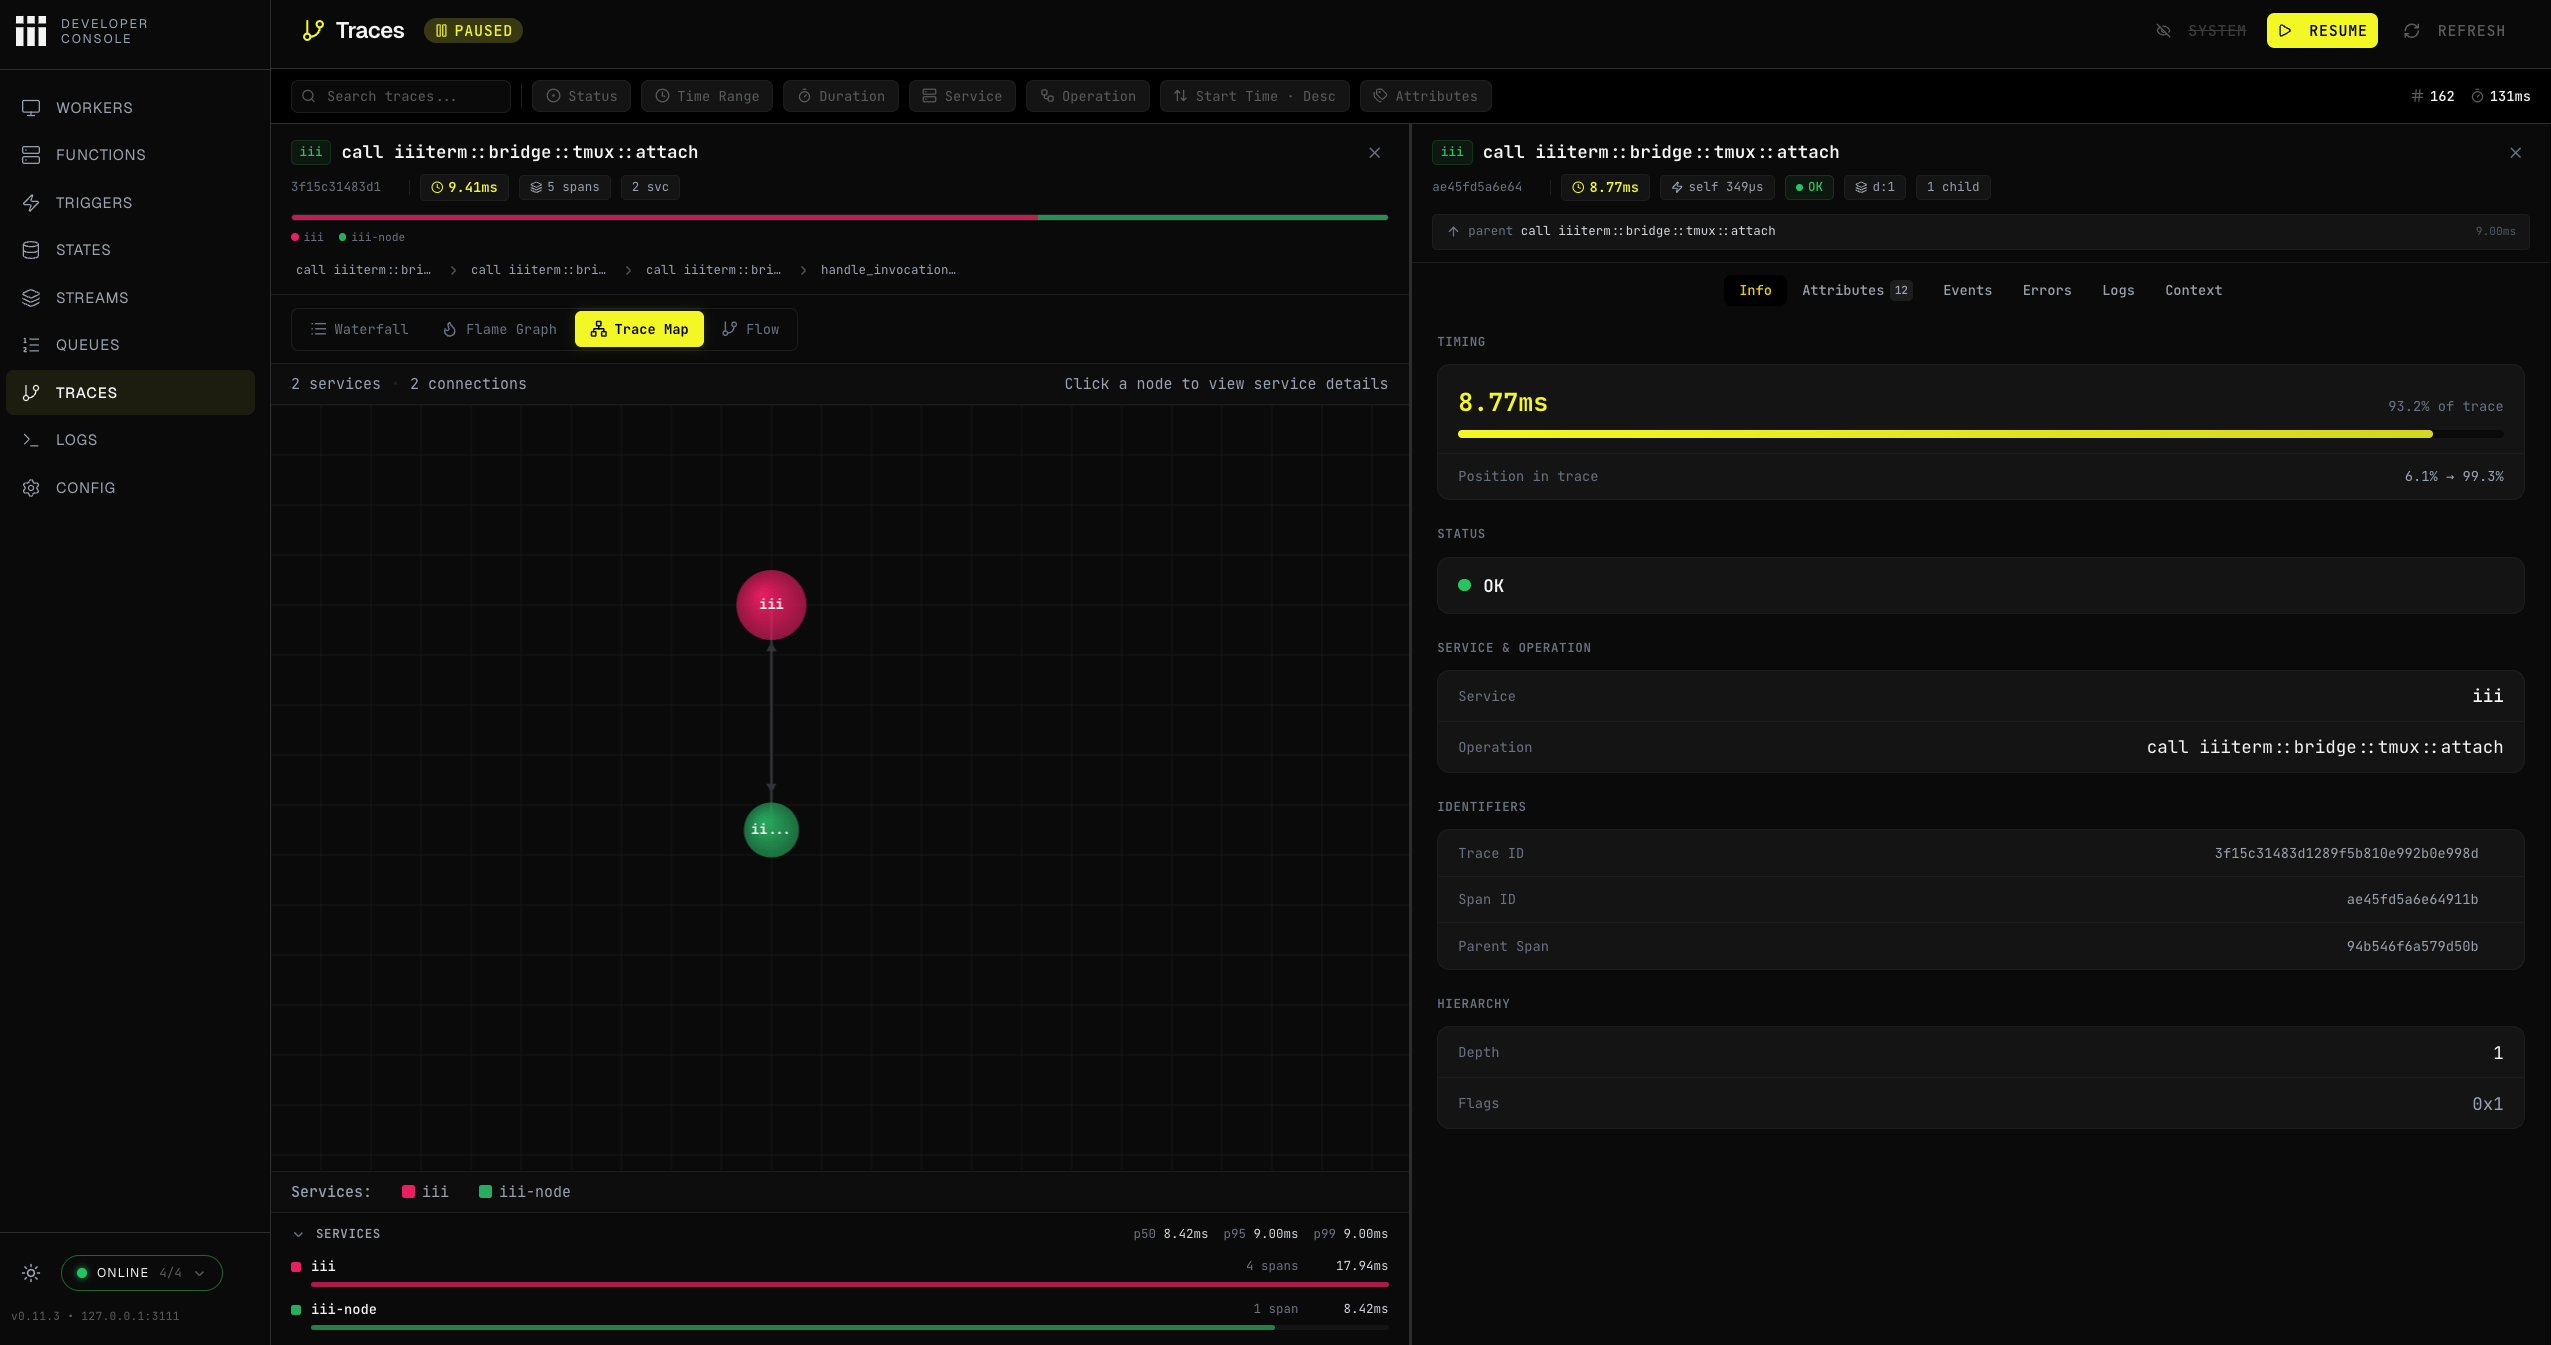
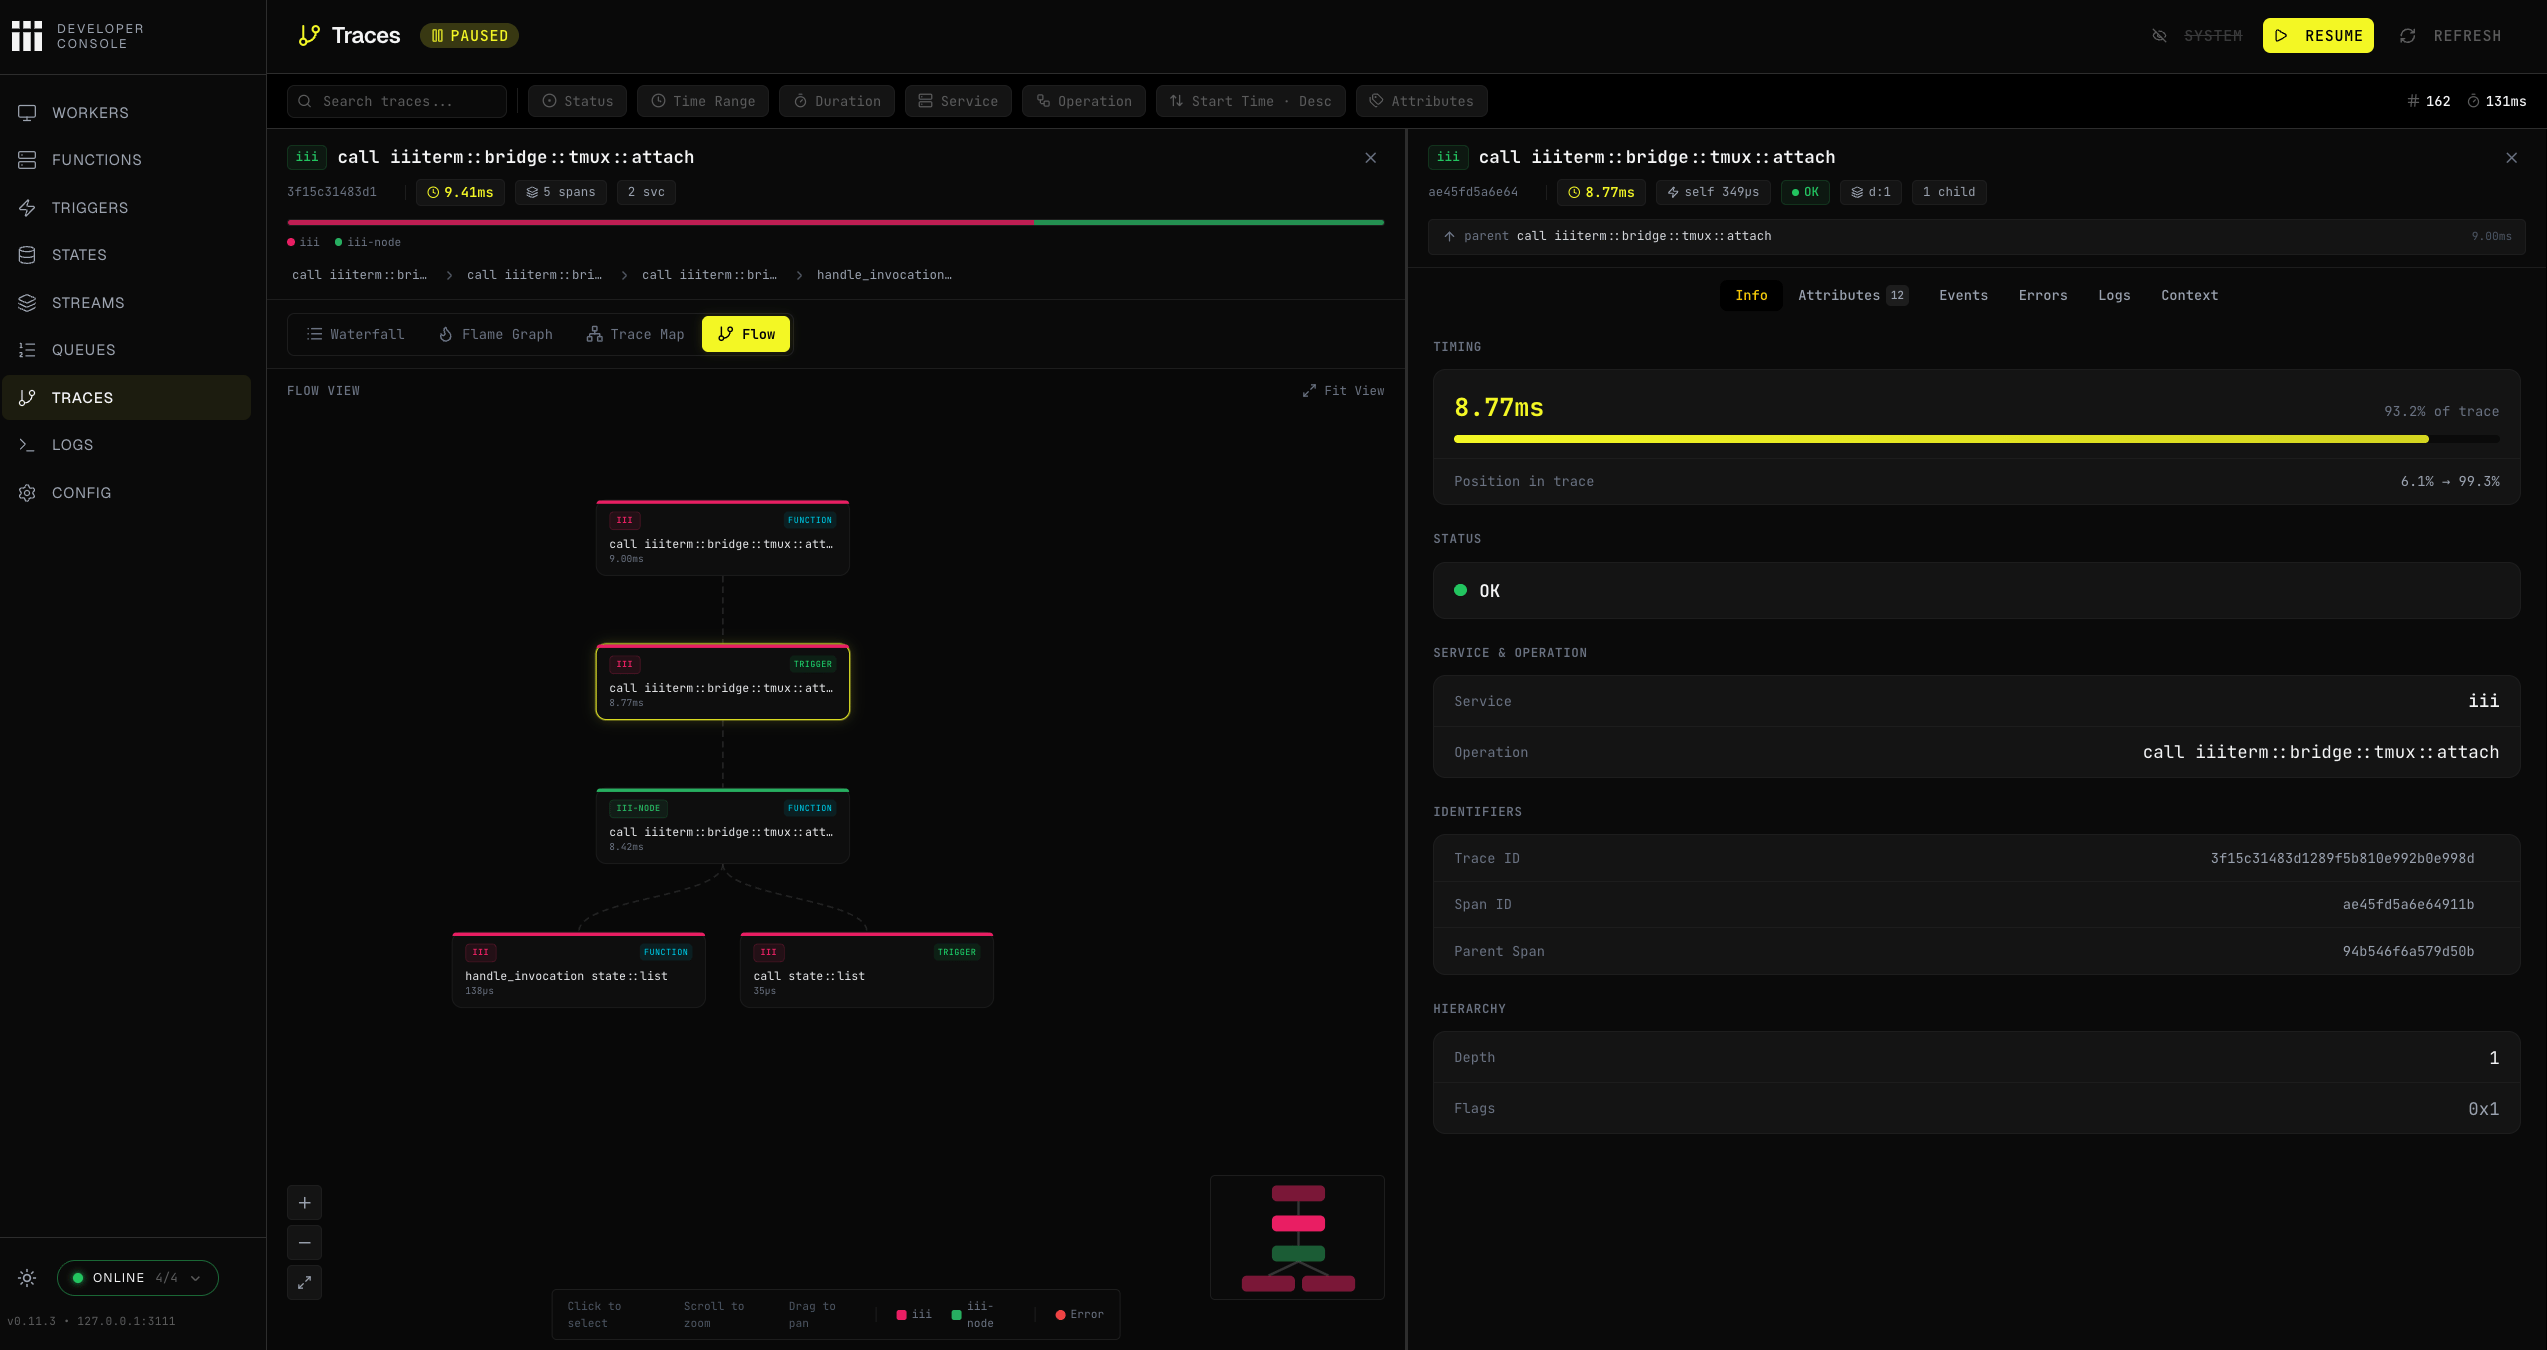
Span Details
The span detail panel includes the following tabs:Trace Filtering
Multiple filters are combined with AND logic. Pagination controls at the bottom allow browsing large result sets.
See Use the Console for step-by-step instructions on inspecting traces and spans.
Logs
The Logs page provides a viewer for structured OpenTelemetry logs collected by the engine. Logs are displayed in reverse chronological order. Each entry shows a timestamp, severity level, service name, trace/span context, and message. A severity filter toggle, full-text search, and time-range controls let you zero in on specific log entries. The source breakdown at the bottom shows which services are contributing the most log volume.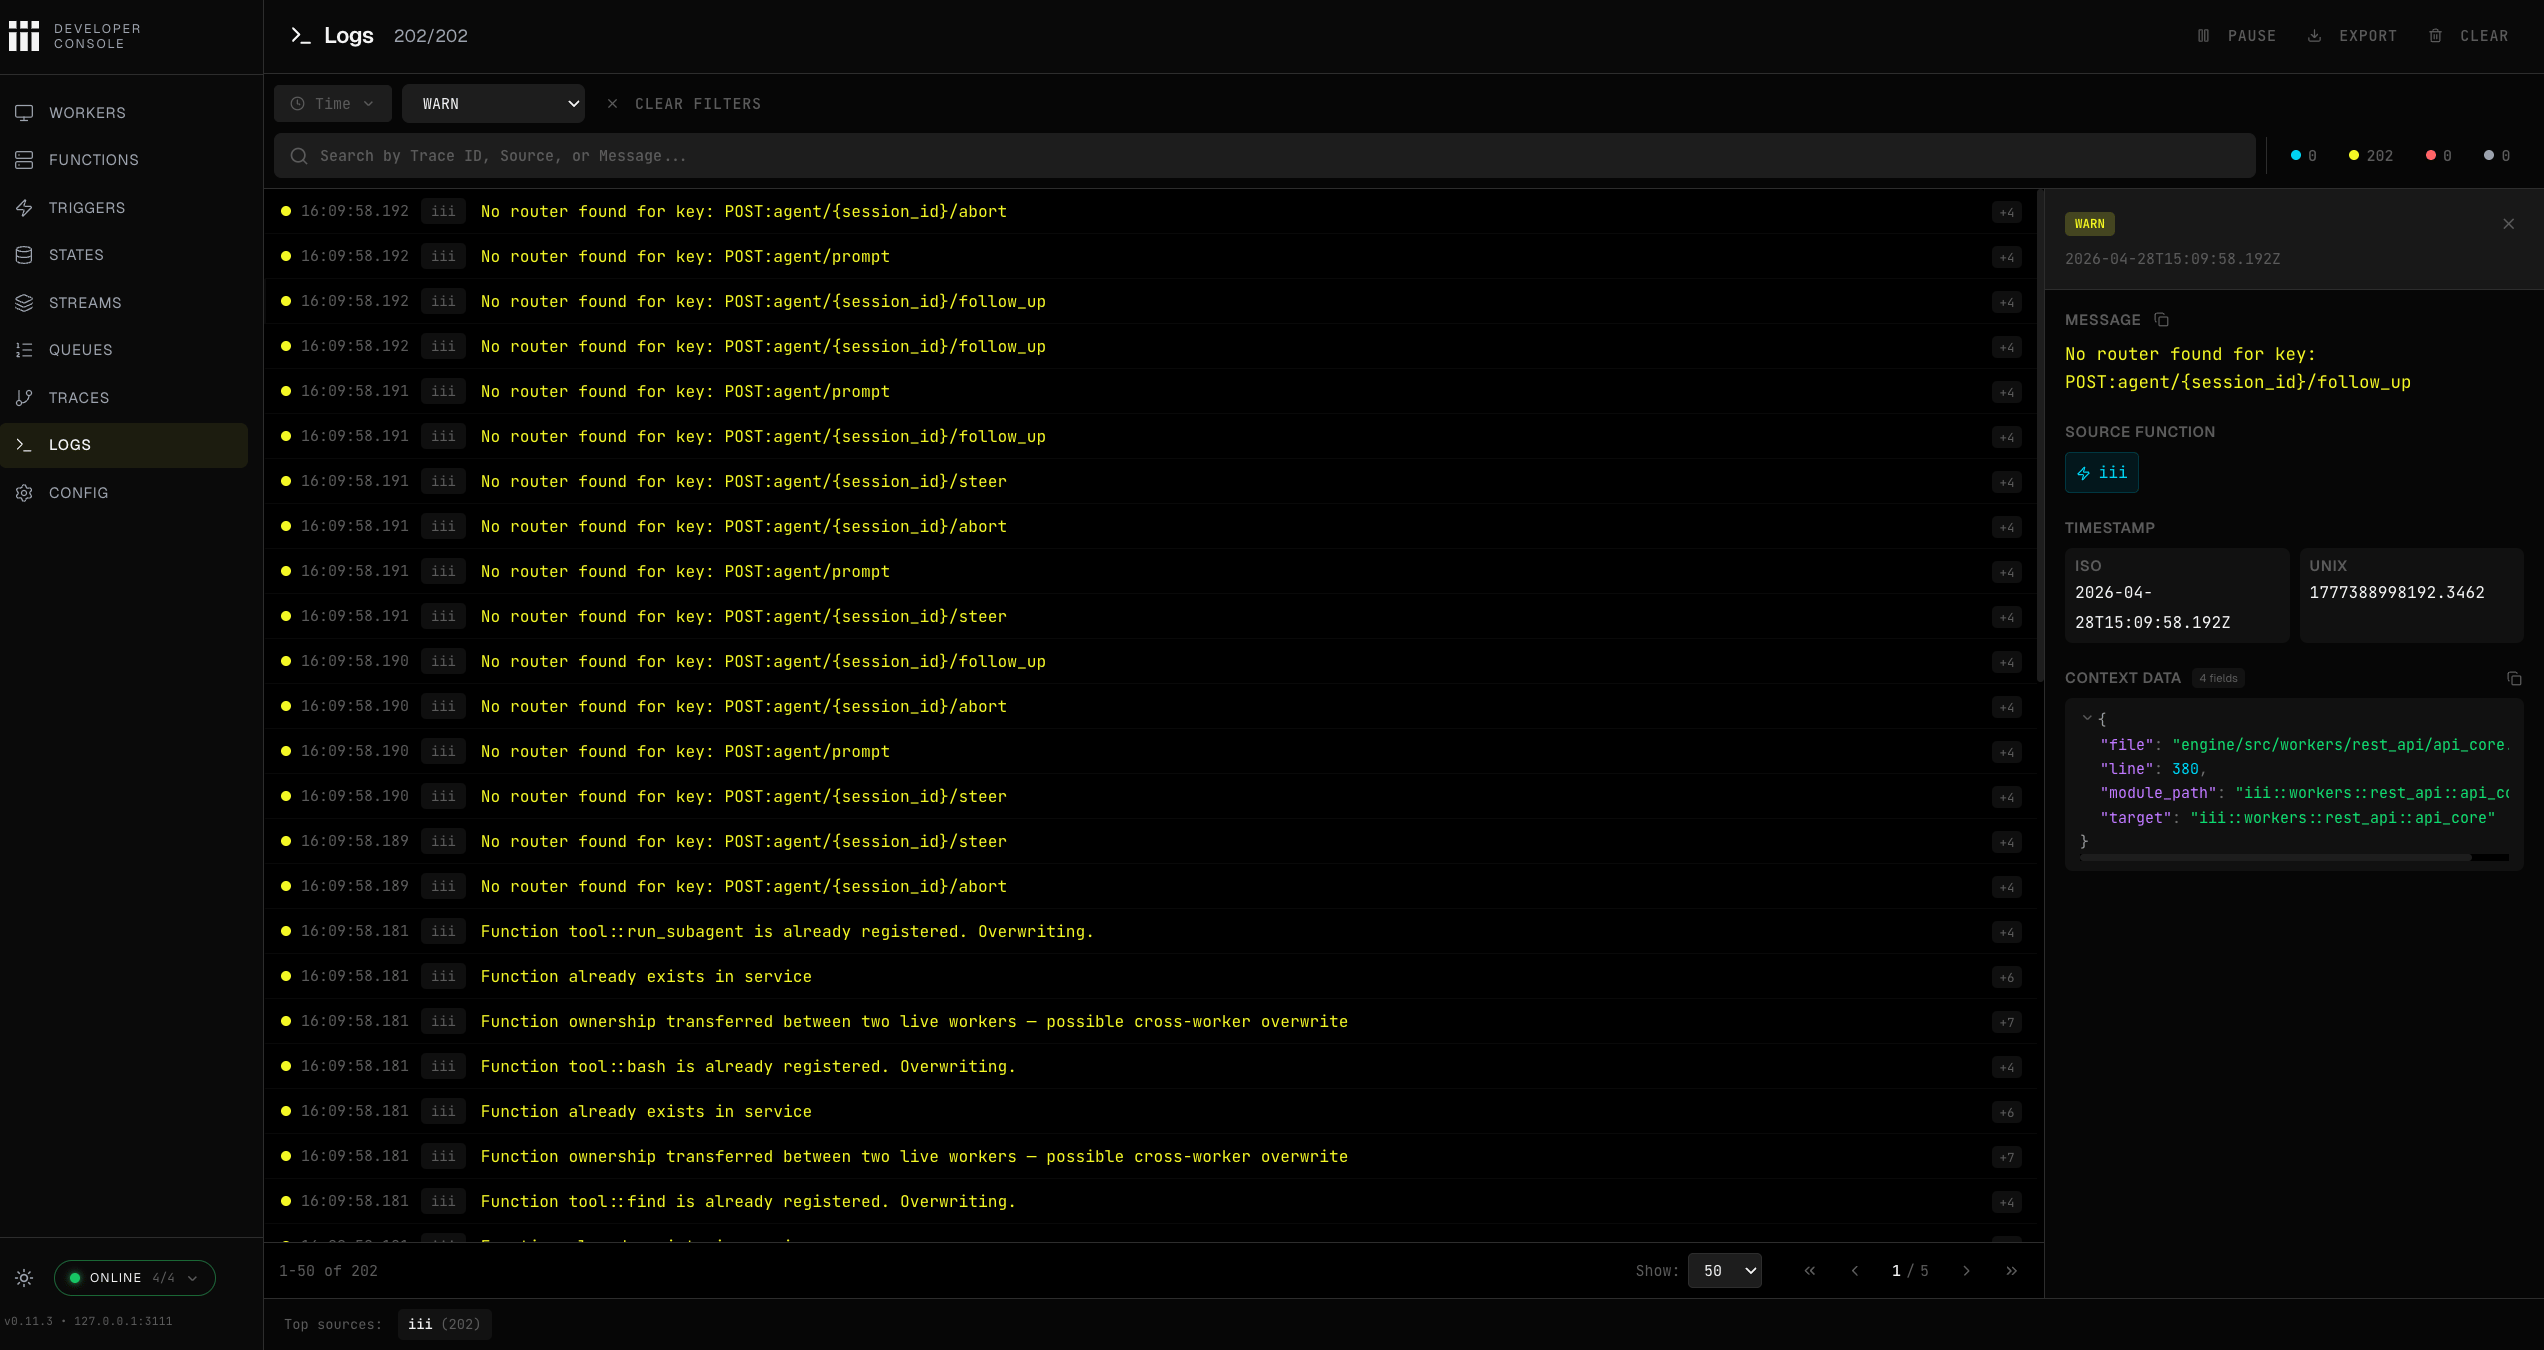
Log collection requires the Observability worker with
logs_enabled: true. See Observability Worker for configuration.The iii Console (this web UI) is separate from the engine’s
logs_console_output setting. The logs_console_output option controls whether OTLP logs are also printed to the engine process’s stdout — it does not affect the Logs page here.Log Viewer
Expanding a log entry reveals the full JSON payload, including attributes, trace/span IDs, and resource metadata.
Log Filtering
Log Entry Details
Each expanded log entry includes:If a log entry has a
trace_id, you can click it to jump directly to the corresponding trace in the Traces section above.Flow
The Flow page renders an interactive graph of your system’s architecture, showing how triggers, functions, state stores, and queues connect.
Edges show the data flow direction between components — from triggers to the functions they invoke, and from functions to the state or queues they interact with.
The graph uses auto-layout (Dagre) and supports pan, zoom, and node inspection. Layout configuration is saved to the engine’s state store and restored on next visit.
See Use the Console for navigation instructions.
Configuration
The iii Console is configured via CLI flags and environment variables. All settings have sensible defaults for local development.